War, Oil, and the Commodities Surge
The Iran conflict has sent oil prices to historic highs while U.S. equities stumble. Here's how the Asymmetric Edge strategy navigated a turbulent start to 2026, why I'm betting on commodities, and what it all means going forward.


At a Glance
The Asymmetric Edge strategy is up 11.8% year-to-date, outperforming the S&P 500 by more than 13%. This is the widest gap between the strategy and its benchmarks since inception, driven by heavy commodity and international equity exposure at a time when U.S. stocks are struggling.
In this issue, I cover the first two months of 2026 and the start of March. A lot has happened: gold crashed and recovered, the U.S. and Israel launched a war on Iran, oil posted its biggest weekly gain in futures history, and the February jobs report came in far worse than expected. I'll walk through what moved, what changed in the portfolio, and why commodities now make up roughly half of my holdings.
📌 This newsletter explains how I invest my own money, using a simple portfolio of four ETFs. I share what I hold and why, so readers can see one real world approach in action.
Market Movement Summary
- 🚀 Asymmetric Edge leads all benchmarks by the widest margin since inception
- 🛢️ Oil posts its largest weekly gain in history as the Iran war disrupts global supply
- 🥇 Gold up ~20% YTD despite a dramatic crash following the Warsh Fed nomination
- 📉 U.S. economy sheds 92,000 jobs in February, the worst monthly report in months
- 🌏 International markets outperform U.S. equities across the board
Portfolio Shifts

- Russell 2000 and Nasdaq-100 have both exited since January. Japan hedged equity and active commodities have entered
- The portfolio now has zero direct U.S. equity exposure for the first time since inception
Theme of the Month
Stagflation is when economic growth slows and inflation rises at the same time. It's hard to fight because the usual tools, like cutting interest rates, tend to help one problem while making the other worse. In early 2026, surging oil prices from the Iran war, weak job growth, and sticky inflation are combining to create exactly this kind of environment.
One Number That Matters
Roughly 15 million barrels of oil per day flow through the Strait of Hormuz, about a third of all seaborne crude exports worldwide. The effective closure of this waterway due to the Iran war represents one of the largest oil supply disruptions in modern history.
-CNBC
Market Moves
Portfolio & Benchmark Returns
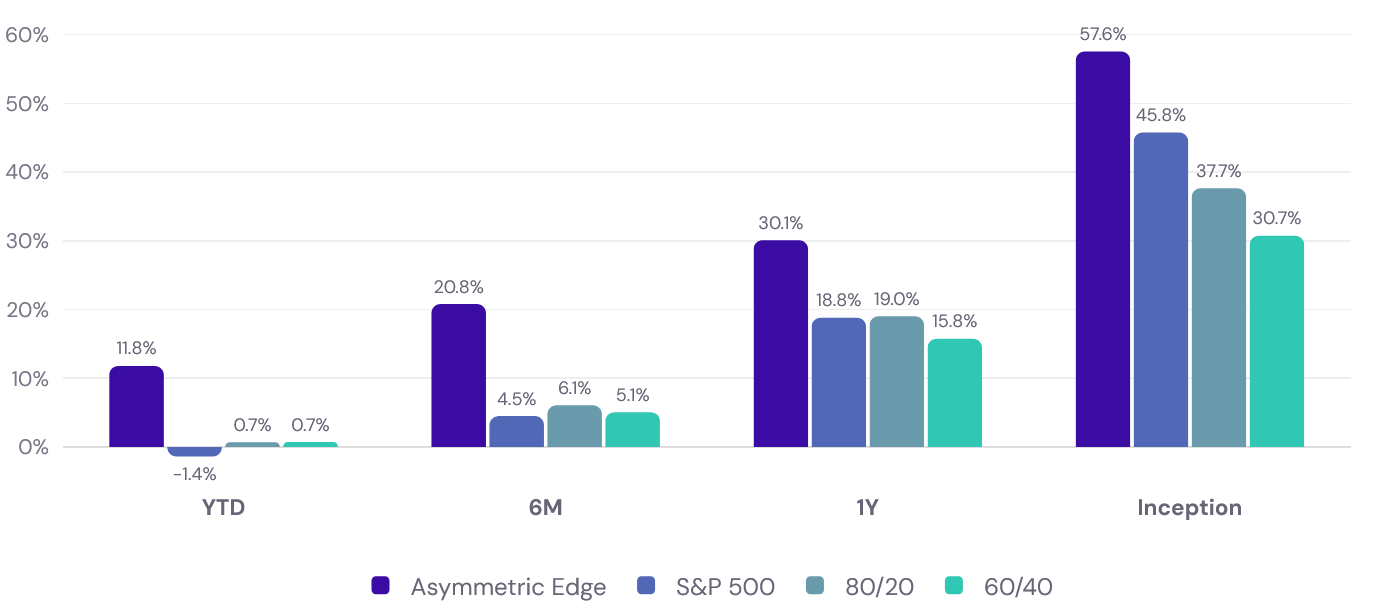
The Asymmetric Edge strategy is outperforming all three benchmarks across every time period shown. Year-to-date, the strategy is up 11.8% versus -1.4% for the S&P 500, 0.7% for an 80/20 portfolio, and 0.7% for 60/40. Over the trailing 12 months, the strategy has returned 30.1%, well ahead of the S&P 500's 18.8%.
Charting the Growth of $10,000
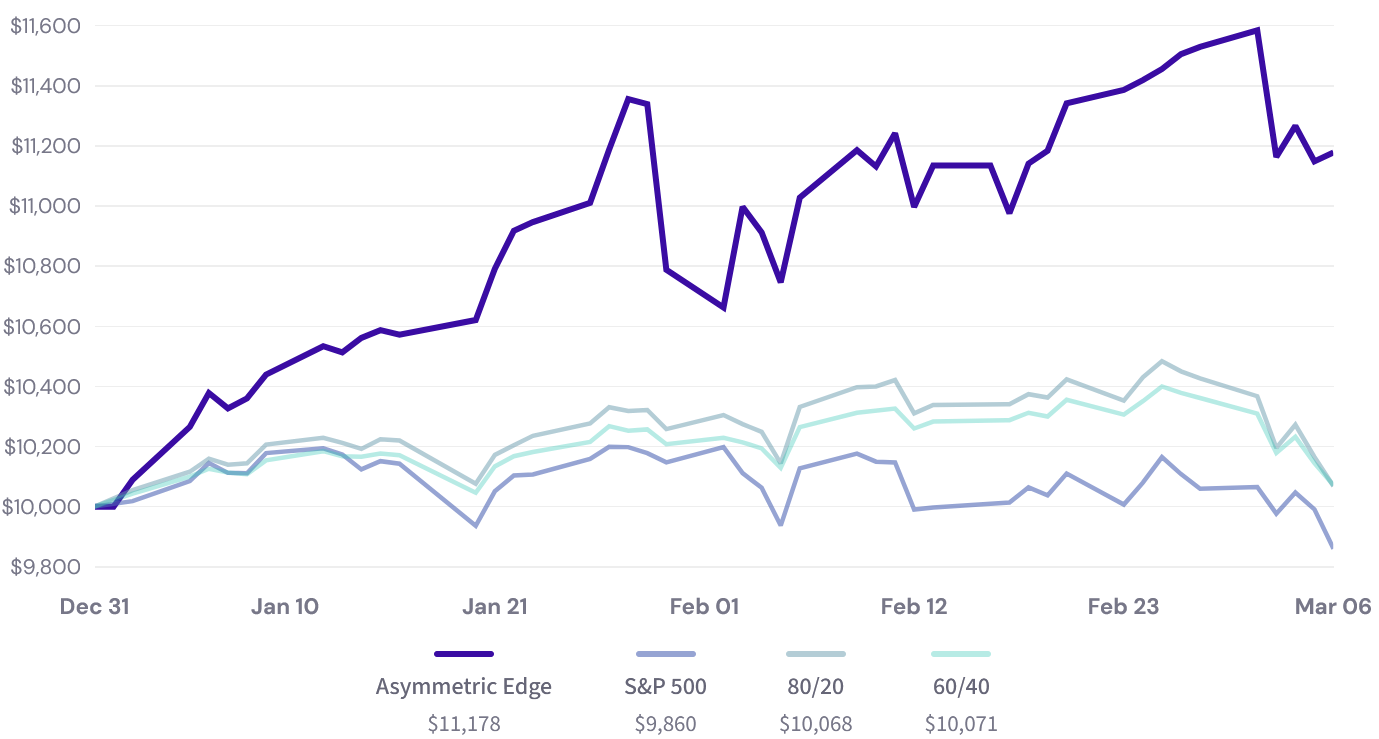
Year-to-Date
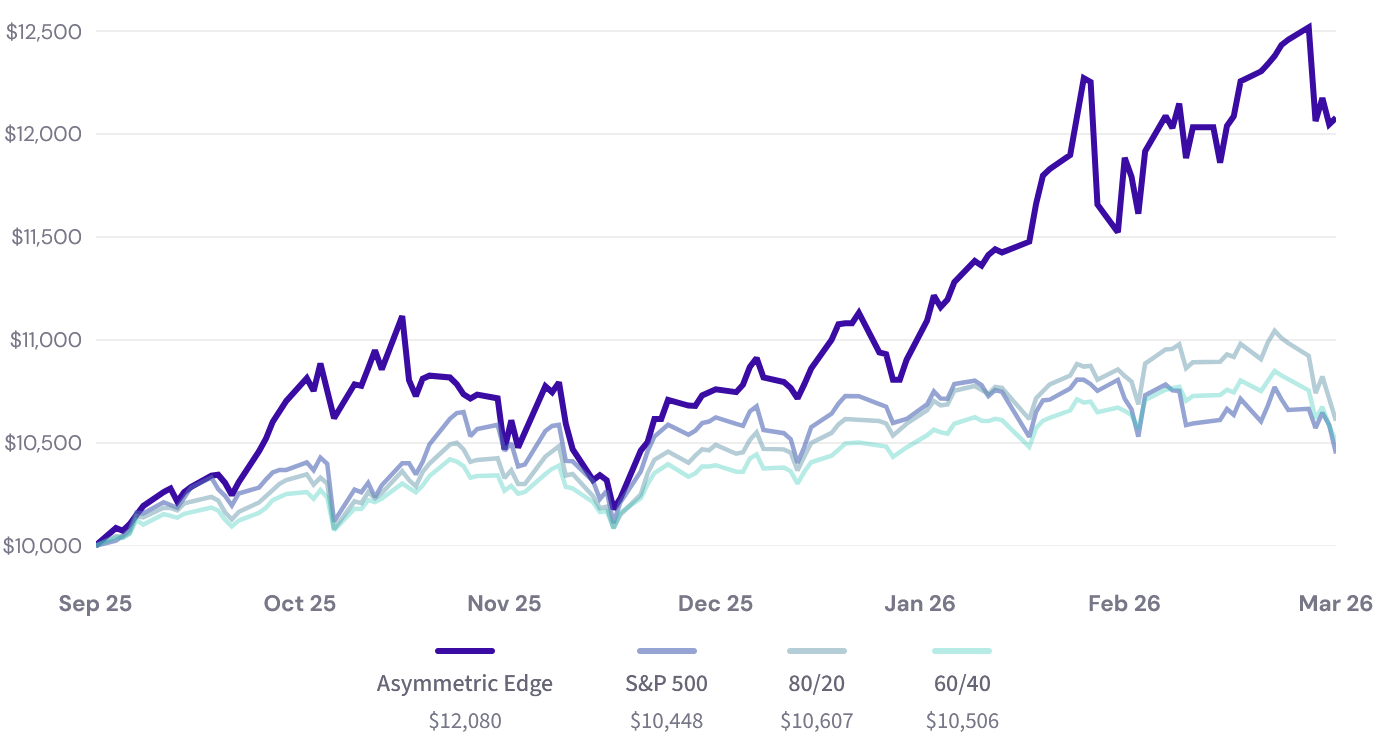
Trailing 6 Months
The YTD chart shows how the strategy surged in early January, pulled back sharply with the precious metals crash on January 30, and then recovered. Even after the recent dip tied to the Iran conflict, $10,000 invested at the start of the year would be worth $11,178 versus just $9,860 in the S&P 500.
The trailing 6-month view is even more striking: a hypothetical $10,000 invested six months ago would have grown to $12,080 in the strategy, compared to $10,448 in the S&P 500 and roughly $10,500-$10,600 in balanced portfolios. The divergence since late December has been dramatic.
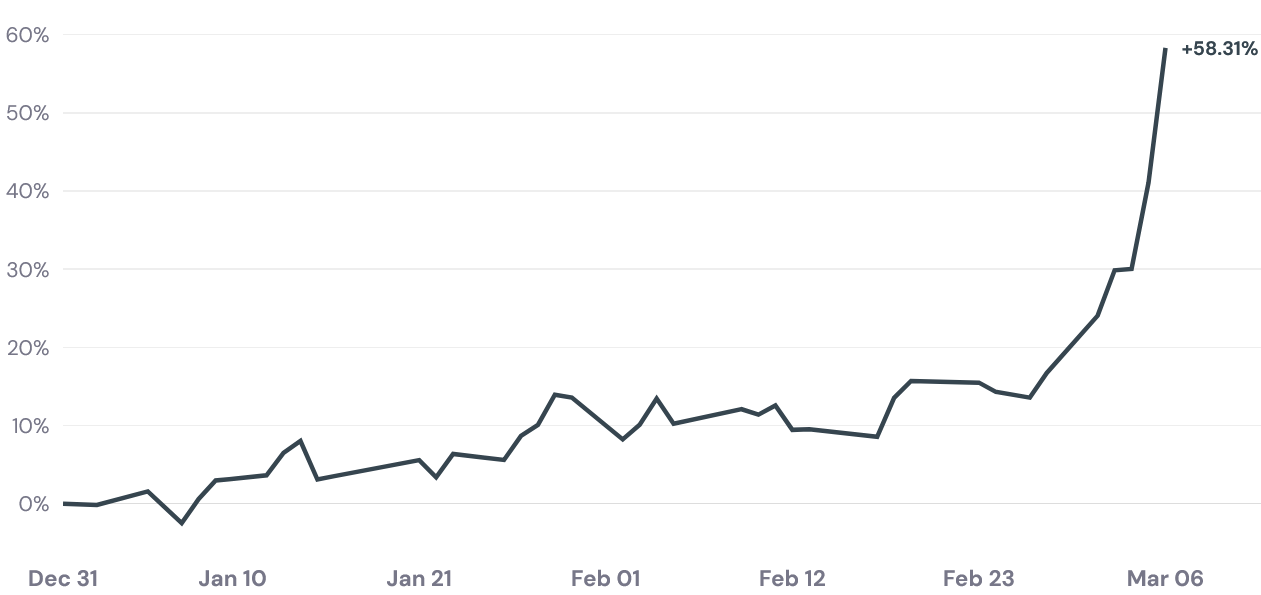
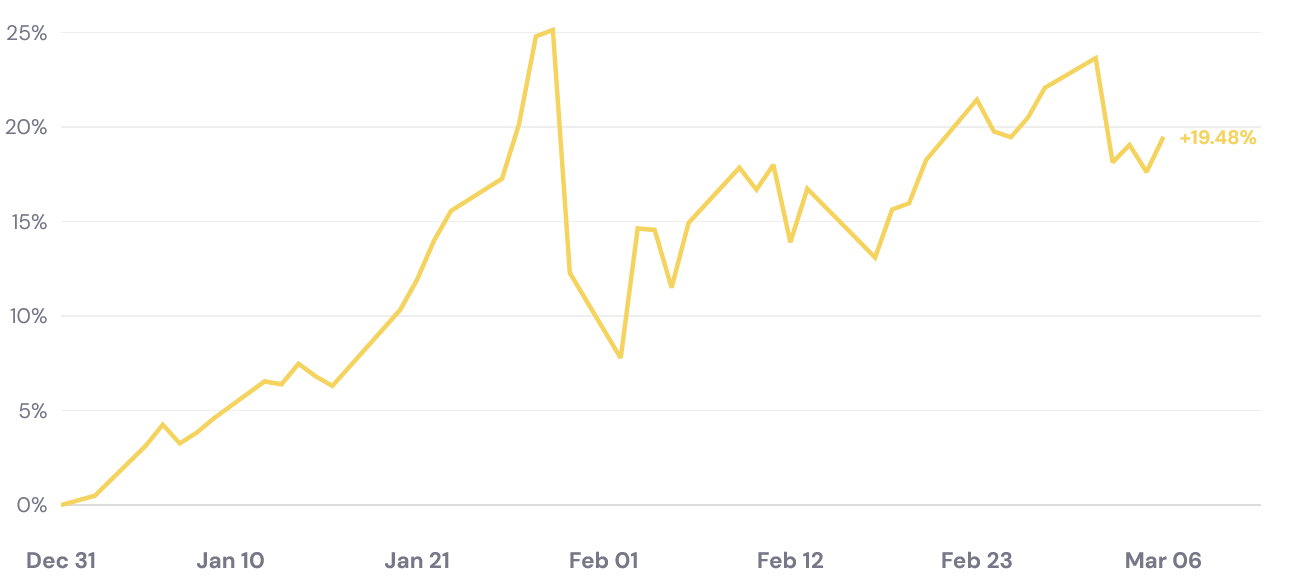
Year-to-Date Returns
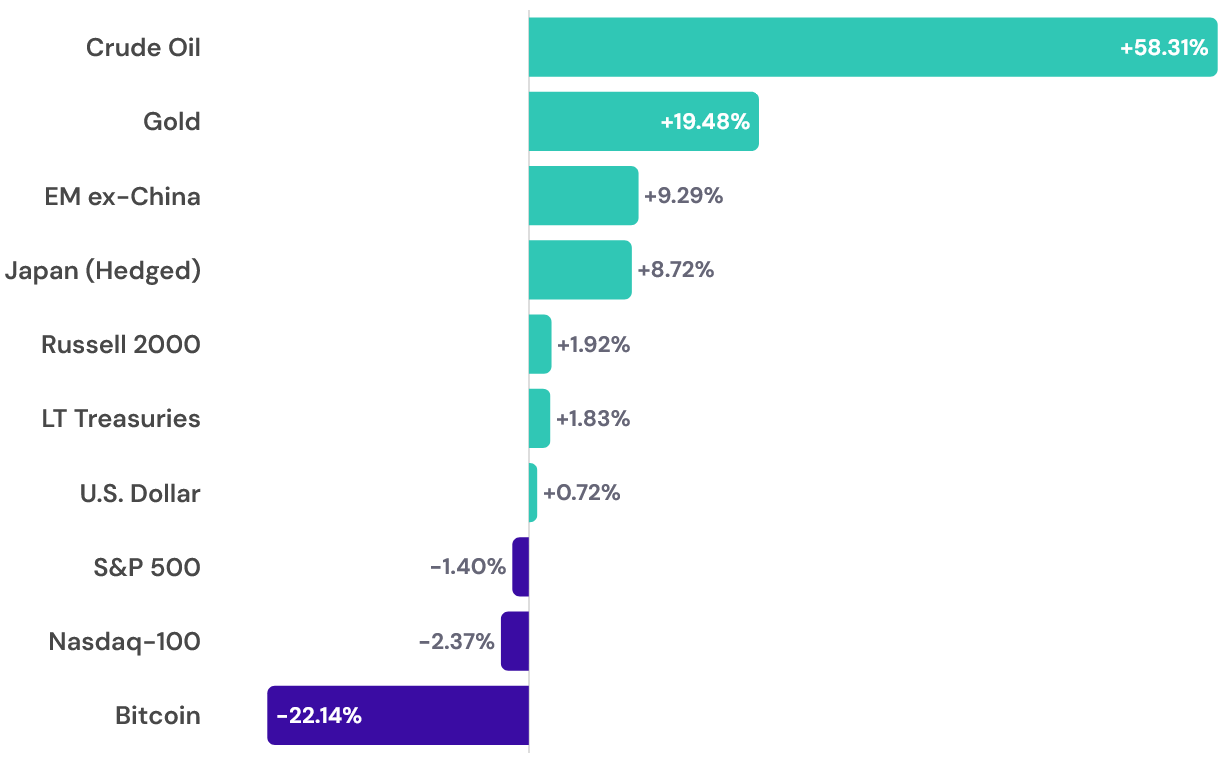
The YTD picture tells the story of a market in transition.
Crude oil leads at +58.3%, propelled almost entirely by the Iran war and the disruption to the Strait of Hormuz.
Gold is up 19.5% despite its sharp Warsh-driven crash in late January.
Emerging markets ex-China (+9.3%) and Japan hedged equity (+8.7%) continue to outperform U.S. markets.
Meanwhile, U.S. equities are struggling: the S&P 500 is down 1.4%, the Nasdaq is off 2.4%, and the Russell 2000 (+1.9%) gave back most of a blazing January start as rate cut expectations faded.
Bitcoin continues its painful slide, down 22.1%.
Crude Oil Surges
Several forces are shaping these moves. The US-Israel war on Iran, which began February 28, is the dominant market event right now, sending oil surging and rattling global equities.
The February jobs report showed 92,000 jobs lost, pushing unemployment to 4.4% and raising concerns about economic momentum.
A broader rotation into international equities, small-cap value, and commodities was well underway before the war began, driven by stretched U.S. tech valuations and a weakening dollar. Whether that rotation continues or reverses will depend largely on how the conflict unfolds.
The dollar, which had fallen to multi-year lows by late January, has rebounded significantly on safe-haven demand from the war. If that reversal holds, it could become a headwind for international and commodity positions.
Portfolio Allocations for March
| Asset | Ticker | Weight | Purpose |
|---|---|---|---|
| 🏭 Active Commodities | HGER | 30.08% | Broad commodity exposure with inflation sensitivity |
| 🌏 EM ex-China | EMXC | 28.41% | Emerging markets diversification without China risk |
| ⛩️ Japan Hedged Equity | DXJ | 22.23% | International equity exposure with USD/JPY hedge |
| 🟨 Gold | GLD | 19.28% | Inflation & crisis hedge |
This is the most significant reshaping of the portfolio since inception. I now hold zero direct U.S. equity exposure, with the strategy rotating entirely into commodities, international equities, and gold. Here's what's driving each position.
Gold (GLD) surged to record highs near $5,600/oz in late January before crashing 9-15% when President Trump nominated Kevin Warsh as Fed Chair, a signal that the dollar would remain credible and the "debasement trade" might be over. Gold recovered throughout February, climbing back above $5,200, and got a safe-haven boost from the Iran war. It has dipped at times since the conflict began, likely due to a stronger dollar and possible disruptions to physical gold flows through Dubai. Despite the volatility, gold's structural supports remain intact, in my view.
Emerging Markets ex-China (EMXC) has been one of the best-performing positions this year. Dollar weakness has made EM assets more attractive, the "friend-shoring" trend continues redirecting manufacturing to India, Vietnam, and Mexico, and EM valuations remain deeply discounted relative to U.S. stocks. Country-level standouts include South Korea, Peru, and Brazil. The Iran war introduces uncertainty, as higher oil prices hurt importers like India and the dollar's war-time bounce is a potential headwind.
Active Long Commodities (HGER) entered the portfolio in February. It tracks the Quantix Commodity Index, spreading exposure across precious metals (~43%), refined petroleum (~22%), industrial metals, grains, and softs, with systematic adjustments based on inflation sensitivity. HGER has benefited from broad commodity strength and received a significant tailwind from surging oil after the Iran war began. If oil stays elevated, HGER could continue to contribute, though a swift resolution could unwind some gains quickly.
Japan Hedged Equity (DXJ) is the newest addition, entering this month. DXJ captures the performance of Japanese stocks while hedging out dollar-yen currency fluctuations, so returns aren't dragged down if the yen weakens. Japan has been a standout for two years, driven by corporate governance reforms and fiscal stimulus under Prime Minister Takaichi. The hedge is especially relevant now, as the dollar has been bouncing on war-related safe-haven flows.
Deep Dive: Why Commodities Are Back (and Why I Own Them)

If you had told me at the start of 2024 that nearly half my portfolio would eventually be in commodities, I might have been skeptical. But here we are. Between HGER (30%) and GLD (19%), about 49% of the strategy is allocated to commodity-linked assets. That's not a bet I'm making on a hunch. It's the result of relative strength momentum pushing these assets to the top of the rankings.
Commodities tend to do well in environments like the one we're in right now. Geopolitical conflict disrupts supply chains, which drives up the price of physical resources. Inflation expectations rise, which makes real assets (things you can touch, like metals and oil) more attractive relative to financial assets (like stocks and bonds). And when the dollar weakens, commodities priced in dollars become cheaper for the rest of the world, boosting demand.
All three of those conditions have been present in 2026. The Iran war has effectively shut down a third of the world's seaborne oil trade. Inflation concerns are rising alongside gas prices. And the dollar, despite a recent bounce from safe-haven demand, has been in a medium-term downtrend since 2025.
What makes HGER particularly interesting is its "all-weather" design. Unlike a fund that simply goes long crude oil, HGER spreads exposure across precious metals, petroleum, industrial metals, grains, and soft commodities. It systematically adjusts these weights based on inflation sensitivity and market dynamics. This means it isn't a one-trick pony. When gold is strong, HGER captures that. When energy surges, it's positioned there too. And when individual commodities pull back, the diversification helps cushion the blow.
I don't know how long the Iran conflict will last or where oil prices will settle. But I trust the process. The strategy allocated to commodities because that's where momentum pointed, and so far, the data has justified the position.
Wrap Up

This year so far has been anything but calm. Between a historic precious metals crash, the start of a major war, and the weakest jobs market in years, there's been no shortage of reasons to feel uneasy. What's kept me grounded is the same thing that's kept me grounded since I started this strategy: following a tested system instead of reacting to headlines.
The portfolio looks very different than it did three months ago, and that's by design. If conditions change, it will look different three months from now, too. My goal remains the same: to share this approach in a clear, approachable way and to show that disciplined, diversified investing doesn't have to be complicated.

Disclaimer & Disclosure
This newsletter is for informational purposes only and does not constitute financial advice, investment recommendations, or an offer to sell or buy any securities. The content is published as a journal of the author's personal investment activities and is intended for a general audience.
No Investment Advice: The author is not a financial advisor. You should not treat any opinion expressed herein as a specific inducement to make a particular investment or follow a particular strategy, but only as an expression of opinion.
Risk Warning: Investment involves risk, including the possible loss of principal. Past performance is not indicative of future results. No investment strategy or risk management technique can guarantee returns or eliminate risk in any market environment.
Data & Accuracy: Information contained herein has been obtained from sources believed to be reliable, but its accuracy and completeness are not guaranteed. All expressions of opinion are subject to change without notice in reaction to shifting market conditions.
Positions: The author currently holds positions in the securities mentioned in this newsletter. The author may buy or sell these securities at any time without notice.
Copyright: This content is provided solely for the personal use of the subscriber. Any unauthorized copying, forwarding, or distribution of this material is prohibited without prior written consent.