My Strategy's First Correction: Down 11% From Its High
My strategy is further below its high than at any point since it went live. Here's how this decline compares with my live record and with a test of my strategy back to 1995, and how my next rebalance works.


A lot has changed in a week. Last Friday morning, October 30th, I wrote that I was watching the tech selloff closely but wasn't overly concerned. That didn't hold up for long. Hours later, the Nasdaq-100, one of my four funds, had its worst day since June.
October closed as the strategy's worst month since I started it in January 2024—down 4.90%, more than double the 2.31% loss I'd reported through October 29th. Then yesterday, Thursday, November 5th, the Nasdaq-100 fell another 6.36%, led by chip stocks.
So am I concerned now? Yes. If you’re uneasy too, that’s a normal reaction. But being concerned isn’t the same as being worried about the strategy itself. This decline is still within the range I’d expect, so I’m sitting tight.
📌 This newsletter explains how I invest my own money, using a simple portfolio of four ETFs. The aim is to match or exceed the returns of a traditional balanced portfolio, but with shallower drawdowns. I share what I hold and why, so you can watch it play out.
The strategy is now about 11% below its October 6th high, its first correction (a decline of 10% or more from a high) since I started trading it live. It's still up 16.06% for the year, but it was up 24.34% as of October 29th.
Nothing changes until my November 30th rebalance. If my stock funds and Bitcoin keep losing momentum between now and then, defensive funds like gold or T-bills (short-term U.S. government debt) could replace them.
Meanwhile, I’ve spent the past several days running more stress tests on the strategy, looking for weak spots and checking whether it’s still behaving the way it would have in past markets. In short: It is. Run back to 1995 in a hypothetical test, the strategy would have had a decline this size about once every five years, and twice as often from 2015 through 2024.
Below, I compare this decline with my live record and with my test back to 1995, and explain what could change at my November 30th rebalance.
Where Things Stand
MTD: Asymmetric Edge −4.13% vs. 80/20 −1.86%, S&P 500 −3.01%
YTD: Asymmetric Edge +16.06% vs. 80/20 +6.80%, S&P 500 +8.33%
Since 2024: Asymmetric Edge +63.6% vs. 80/20 +46.0%, S&P 500 +60.2%
While my strategy still leads all its benchmarks year to date, this correction has erased its lead over the past six months. Over the full six months, it's down 3.4%, while the 80/20 (my main benchmark, a mix of 80% stocks and 20% bonds) is down less than 1% and the S&P 500 is up 0.7%.
Since its October 6th high, the strategy has fallen 10.8%, while the 80/20 has fallen 4.0% over the same dates. On Thursday, three of my four funds (the Nasdaq-100, small caps, and Bitcoin) fell hard, and only broad commodities rose.
Year-to-Date Growth of $10,000
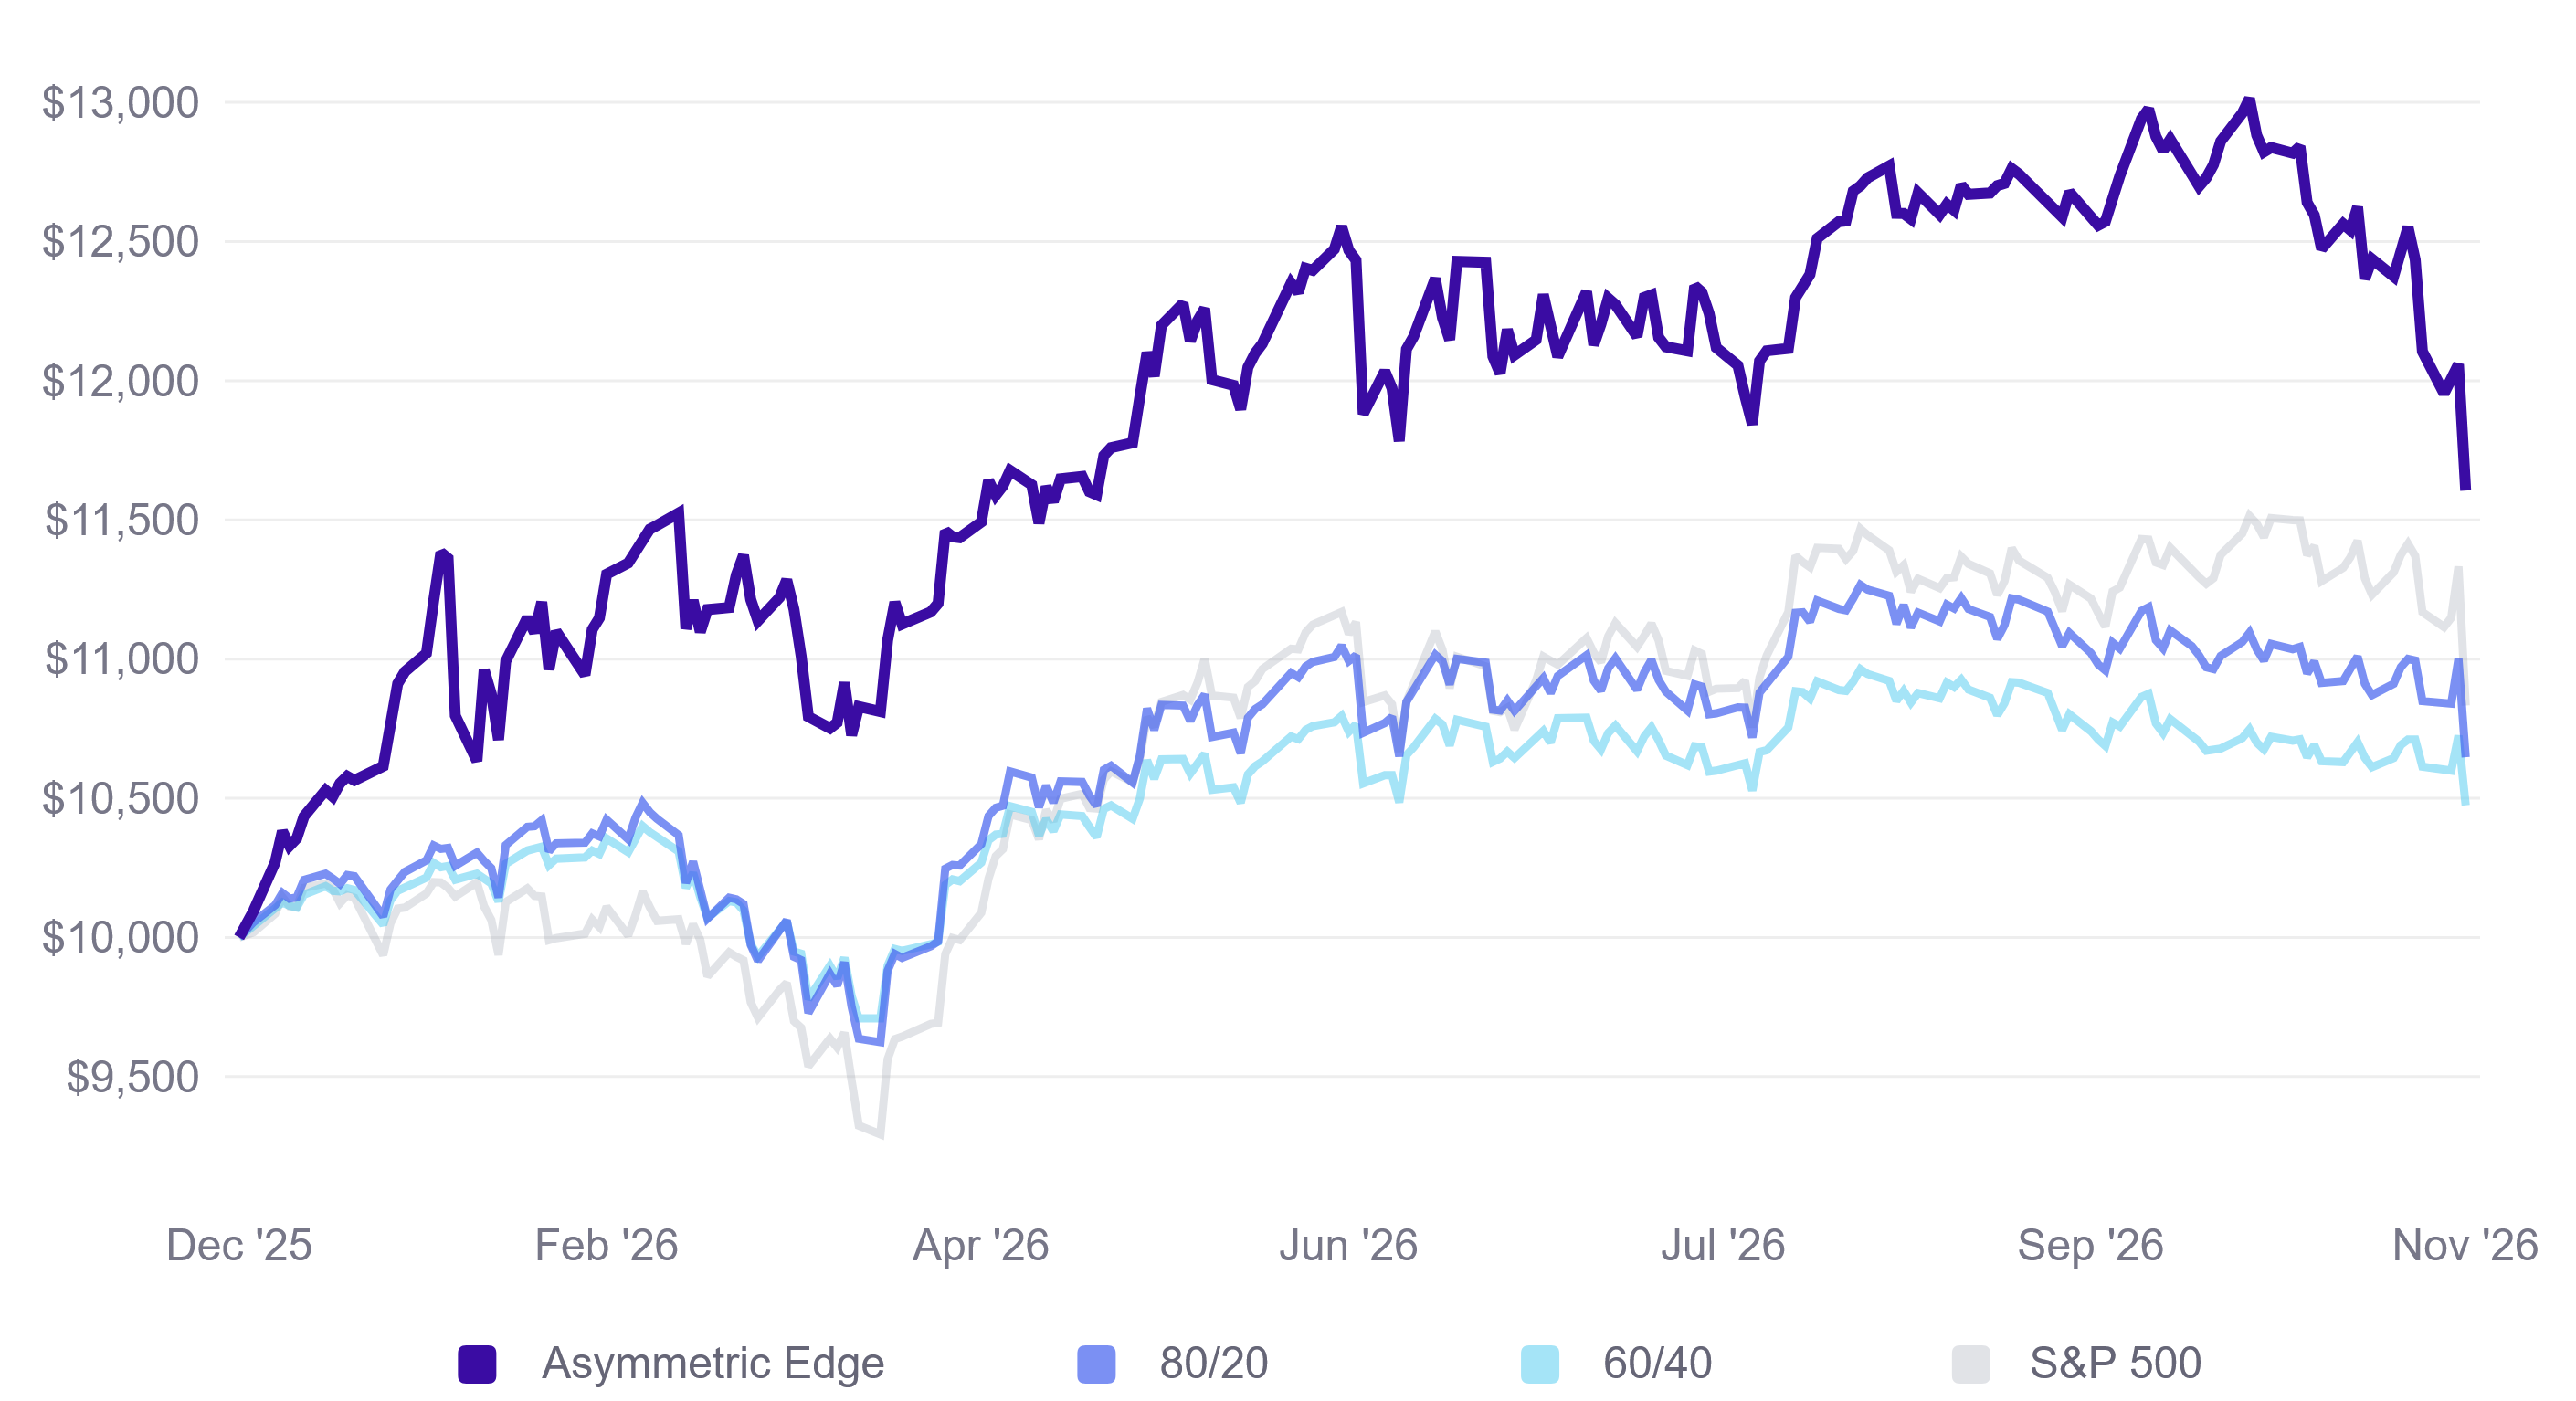
If you started following along in the last several months, it's been a rougher ride. My strategy is still ahead of its benchmarks this year and since going live, but that's not much comfort if you just got here.
The Holdings Responsible for November's Loss so Far
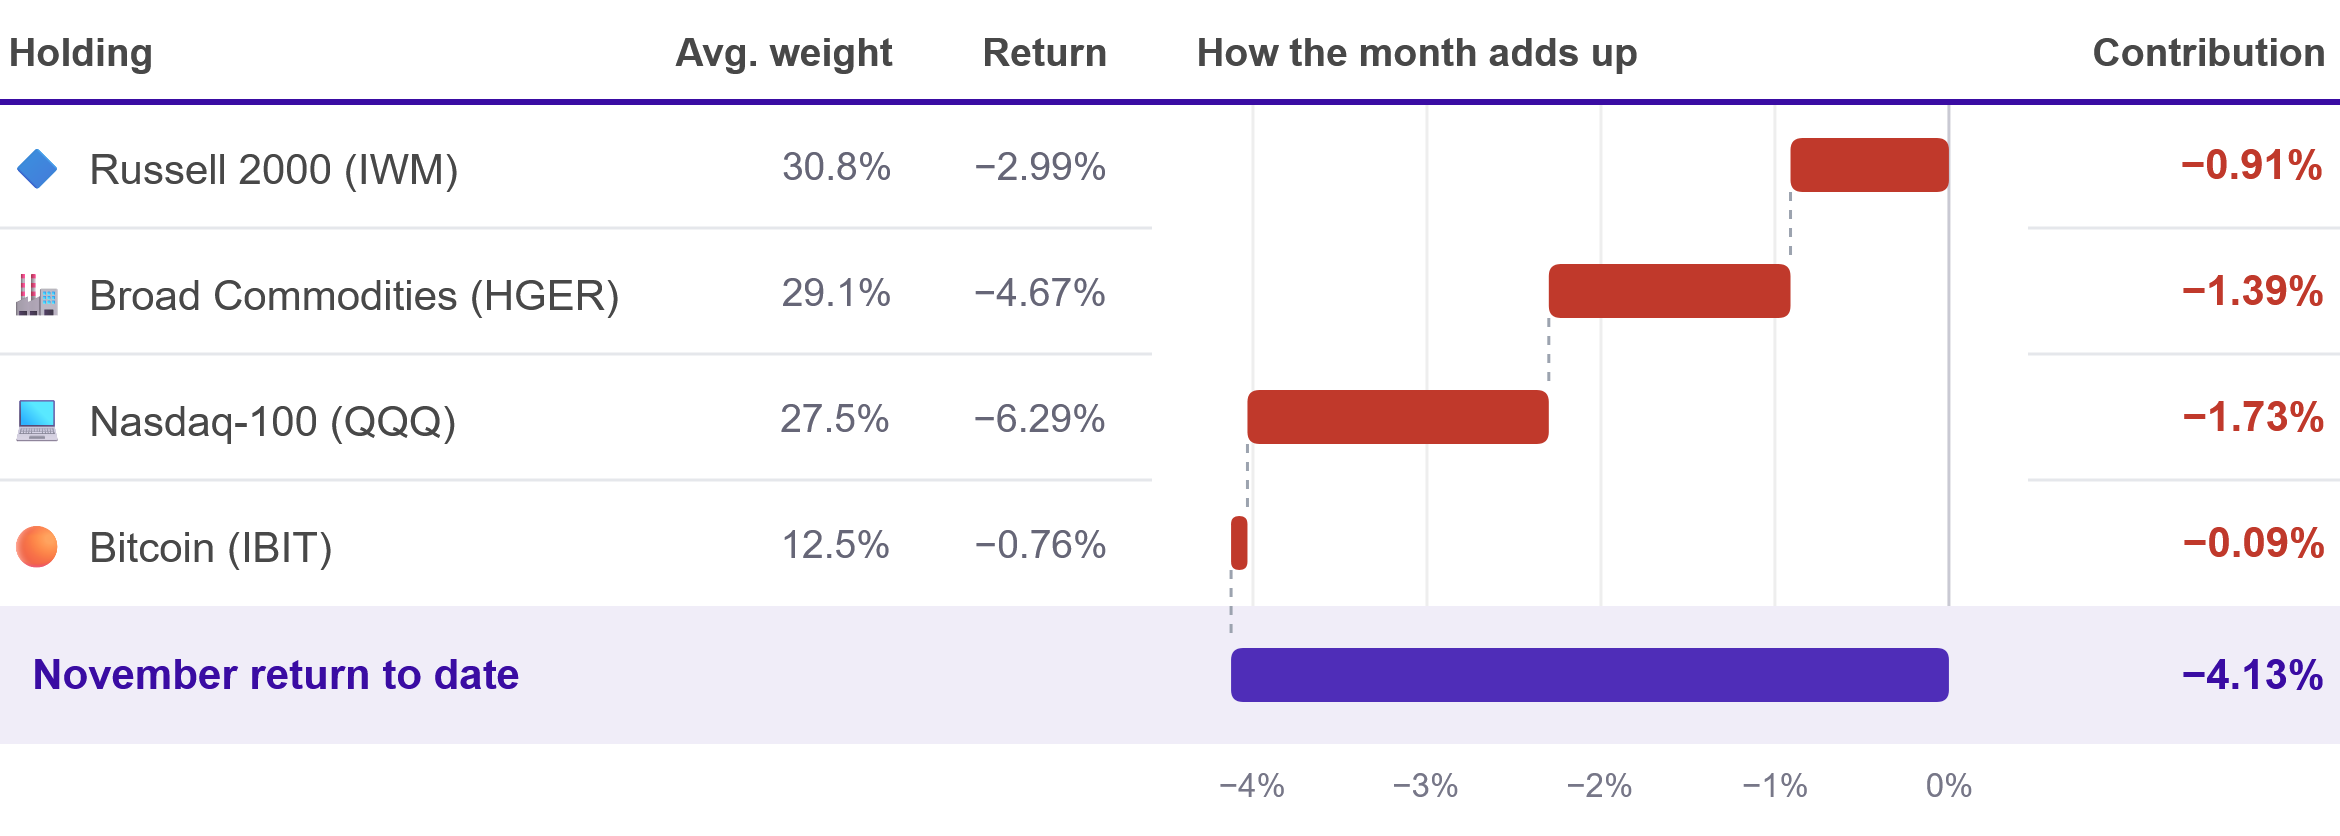
All four of my ETFs are down so far in November. The Nasdaq-100 has done the most damage, taking 1.73% off the portfolio's return, while Bitcoin has taken off only 0.09%.
How Much of My Portfolio Is in Tech
Thursday's selloff was led by chip stocks, so I looked through my four funds to find the specific percentage.
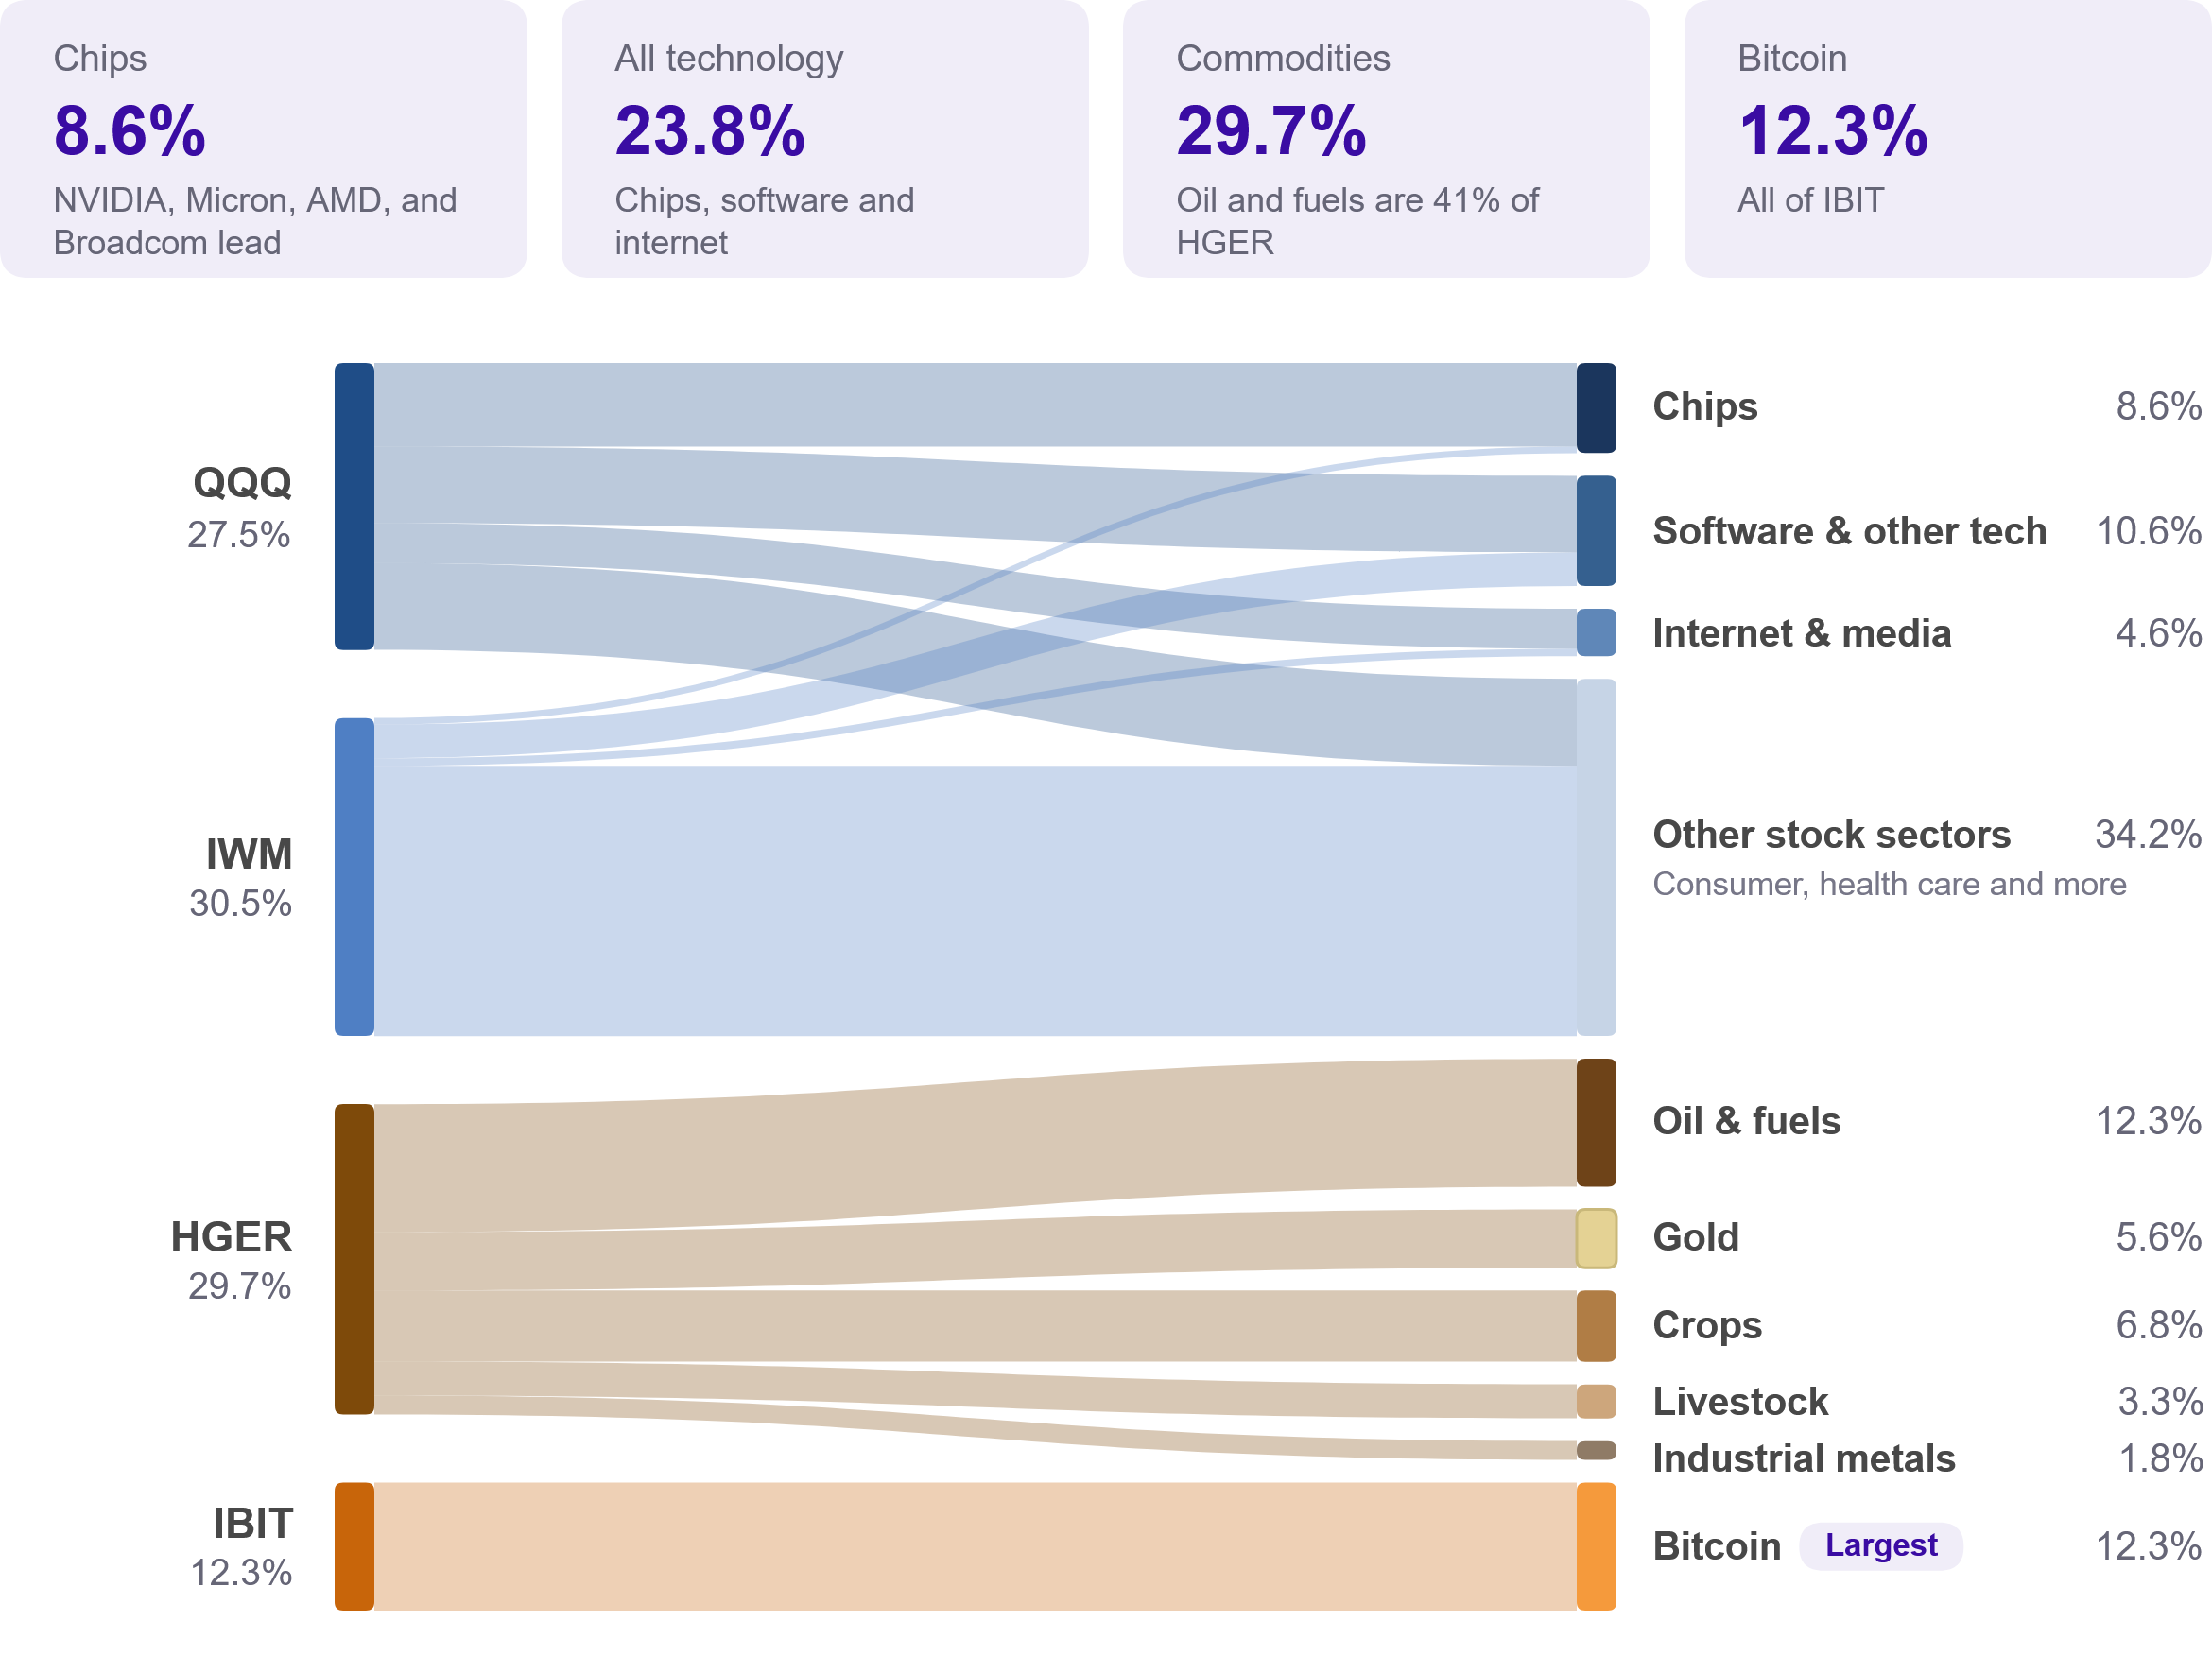
Chipmakers such as NVIDIA, Micron, AMD, and Broadcom make up 8.6% of my portfolio, down from 17.6% in October, when I held emerging markets instead of small caps. Counting software and internet companies too, technology comes to 23.8%.
How This Decline Compares With Past Ones
My Live Record
This is the strategy's largest decline since going live on January 2nd, 2024, but it’s in line with how my strategy would have behaved since 1995. Before this, the largest decline in my live account was 9.23%, which bottomed in August 2024 during a stretch when the S&P 500 fell 8.41%. Then the strategy was back at a new high by October 22nd, 2024, about five months after that decline began.
The April 2025 tariff selloff went the other way. The S&P 500 fell 18.76%, just short of a bear market (a decline of 20% or more), and the 80/20 fell about 13%. My strategy never fell more than about 6%.
How Far Each Portfolio Fell From Its High
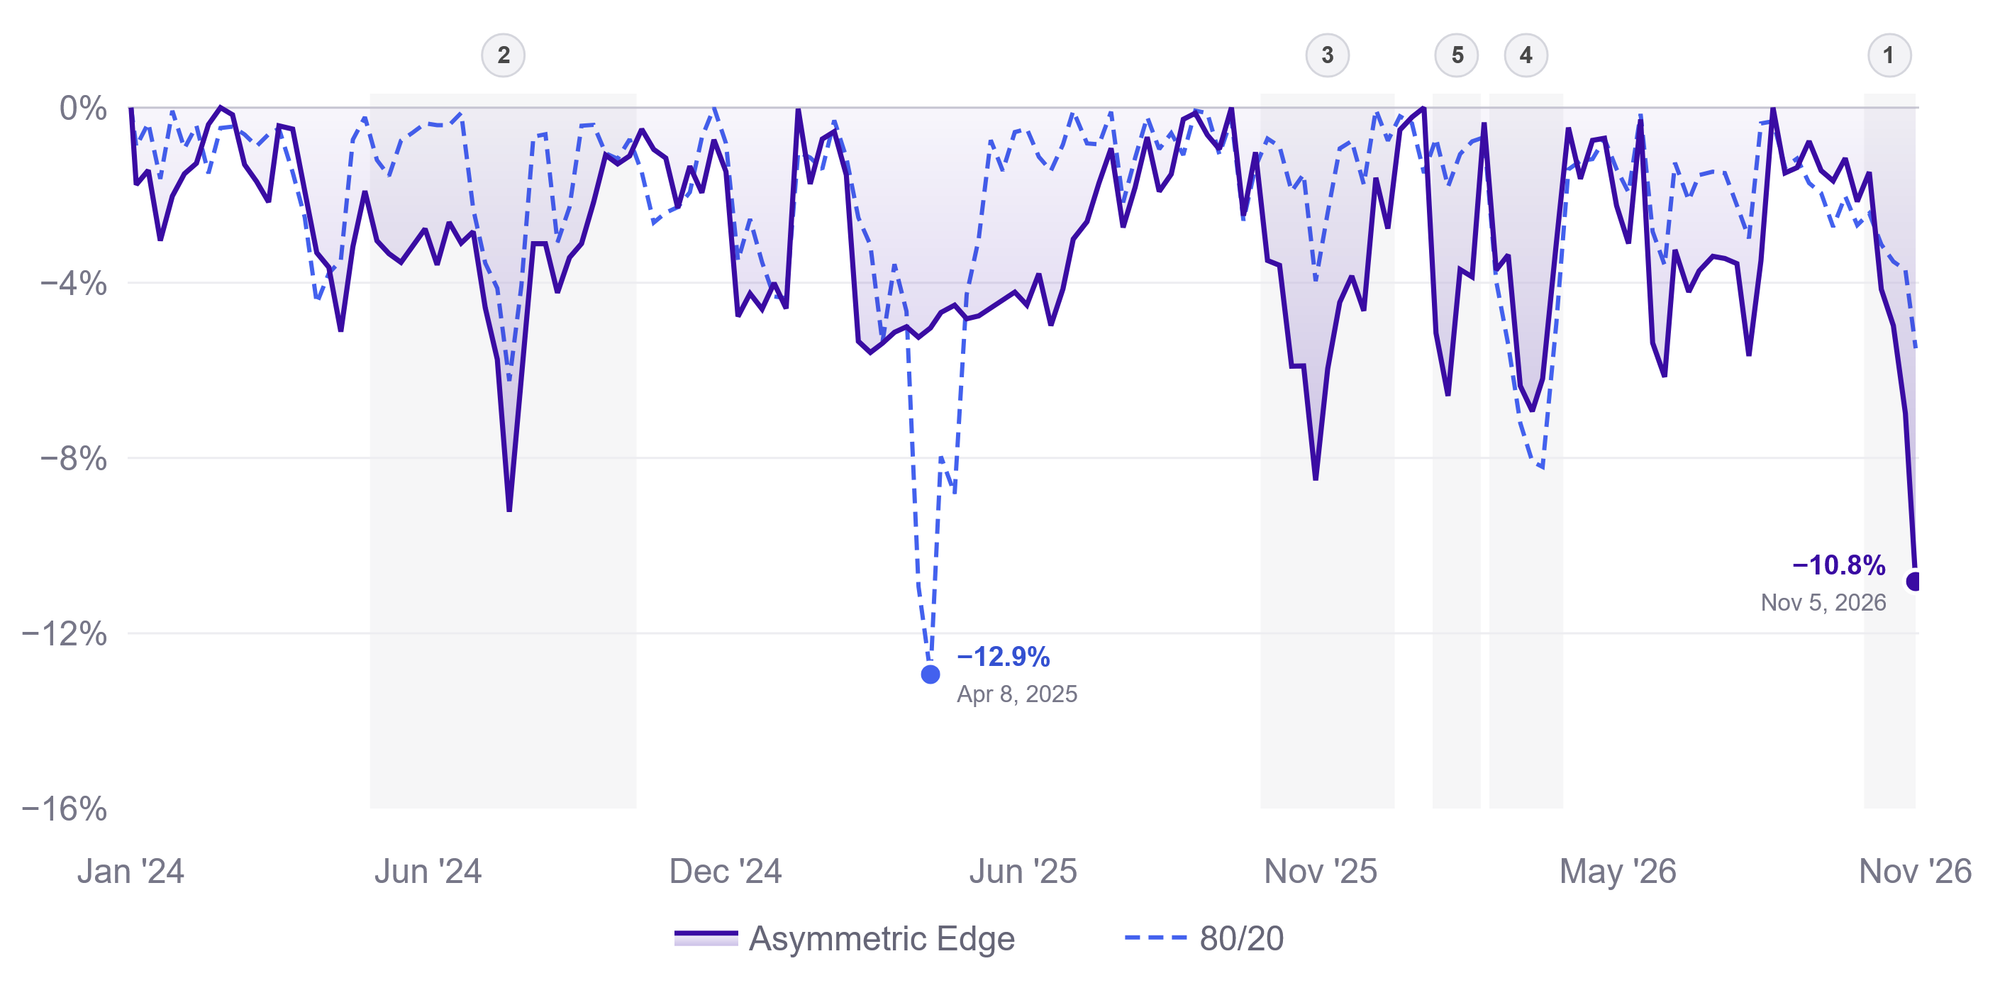
The numbered bands mark the strategy’s five largest declines since launching. Both lines measure each portfolio’s fall from its own high.
In four of those five, including this one, my strategy fell more than an 80/20 portfolio—which goes against my goal of shallower declines. The exception was early 2026 (band 4). The goal held best in April 2025, when the 80/20 fell about 13% and my strategy’s decline was too small to get a band. Even now, at about 11%, my decline is smaller than the 80/20’s was that April.
My Strategy, Run Back to 1995
To see how unusual this decline is, I ran the strategy's exact rules back to June 1995: the same funds, the same momentum measurements, the same volatility-based sizing, and the same month-end rebalance.
Where a fund didn't exist yet, I reconstructed its historical performance using indexes, proxy funds, and research data that track the same investments. Bitcoin joins in 2015, once there's enough price history. No one was actually running this strategy then, so the results are hypothetical. They also have the benefit of hindsight, since I chose these rules knowing how this history played out.
To keep the rules from simply fitting the past, I tested them on years they weren't tuned on (walk-forward testing) and favored rules that held up across many kinds of markets. That improves the odds they'll hold up in the future, though nothing guarantees it.
Every Decline of 10% or More Since 1995
Over those 31 years, the strategy would have had six declines of more than 10%, about one every five years. The largest would have been 15.3%, in 2000, and none would have reached a bear market. Half would have recovered within about seven months, and the other half would have taken 17 to 25 months.
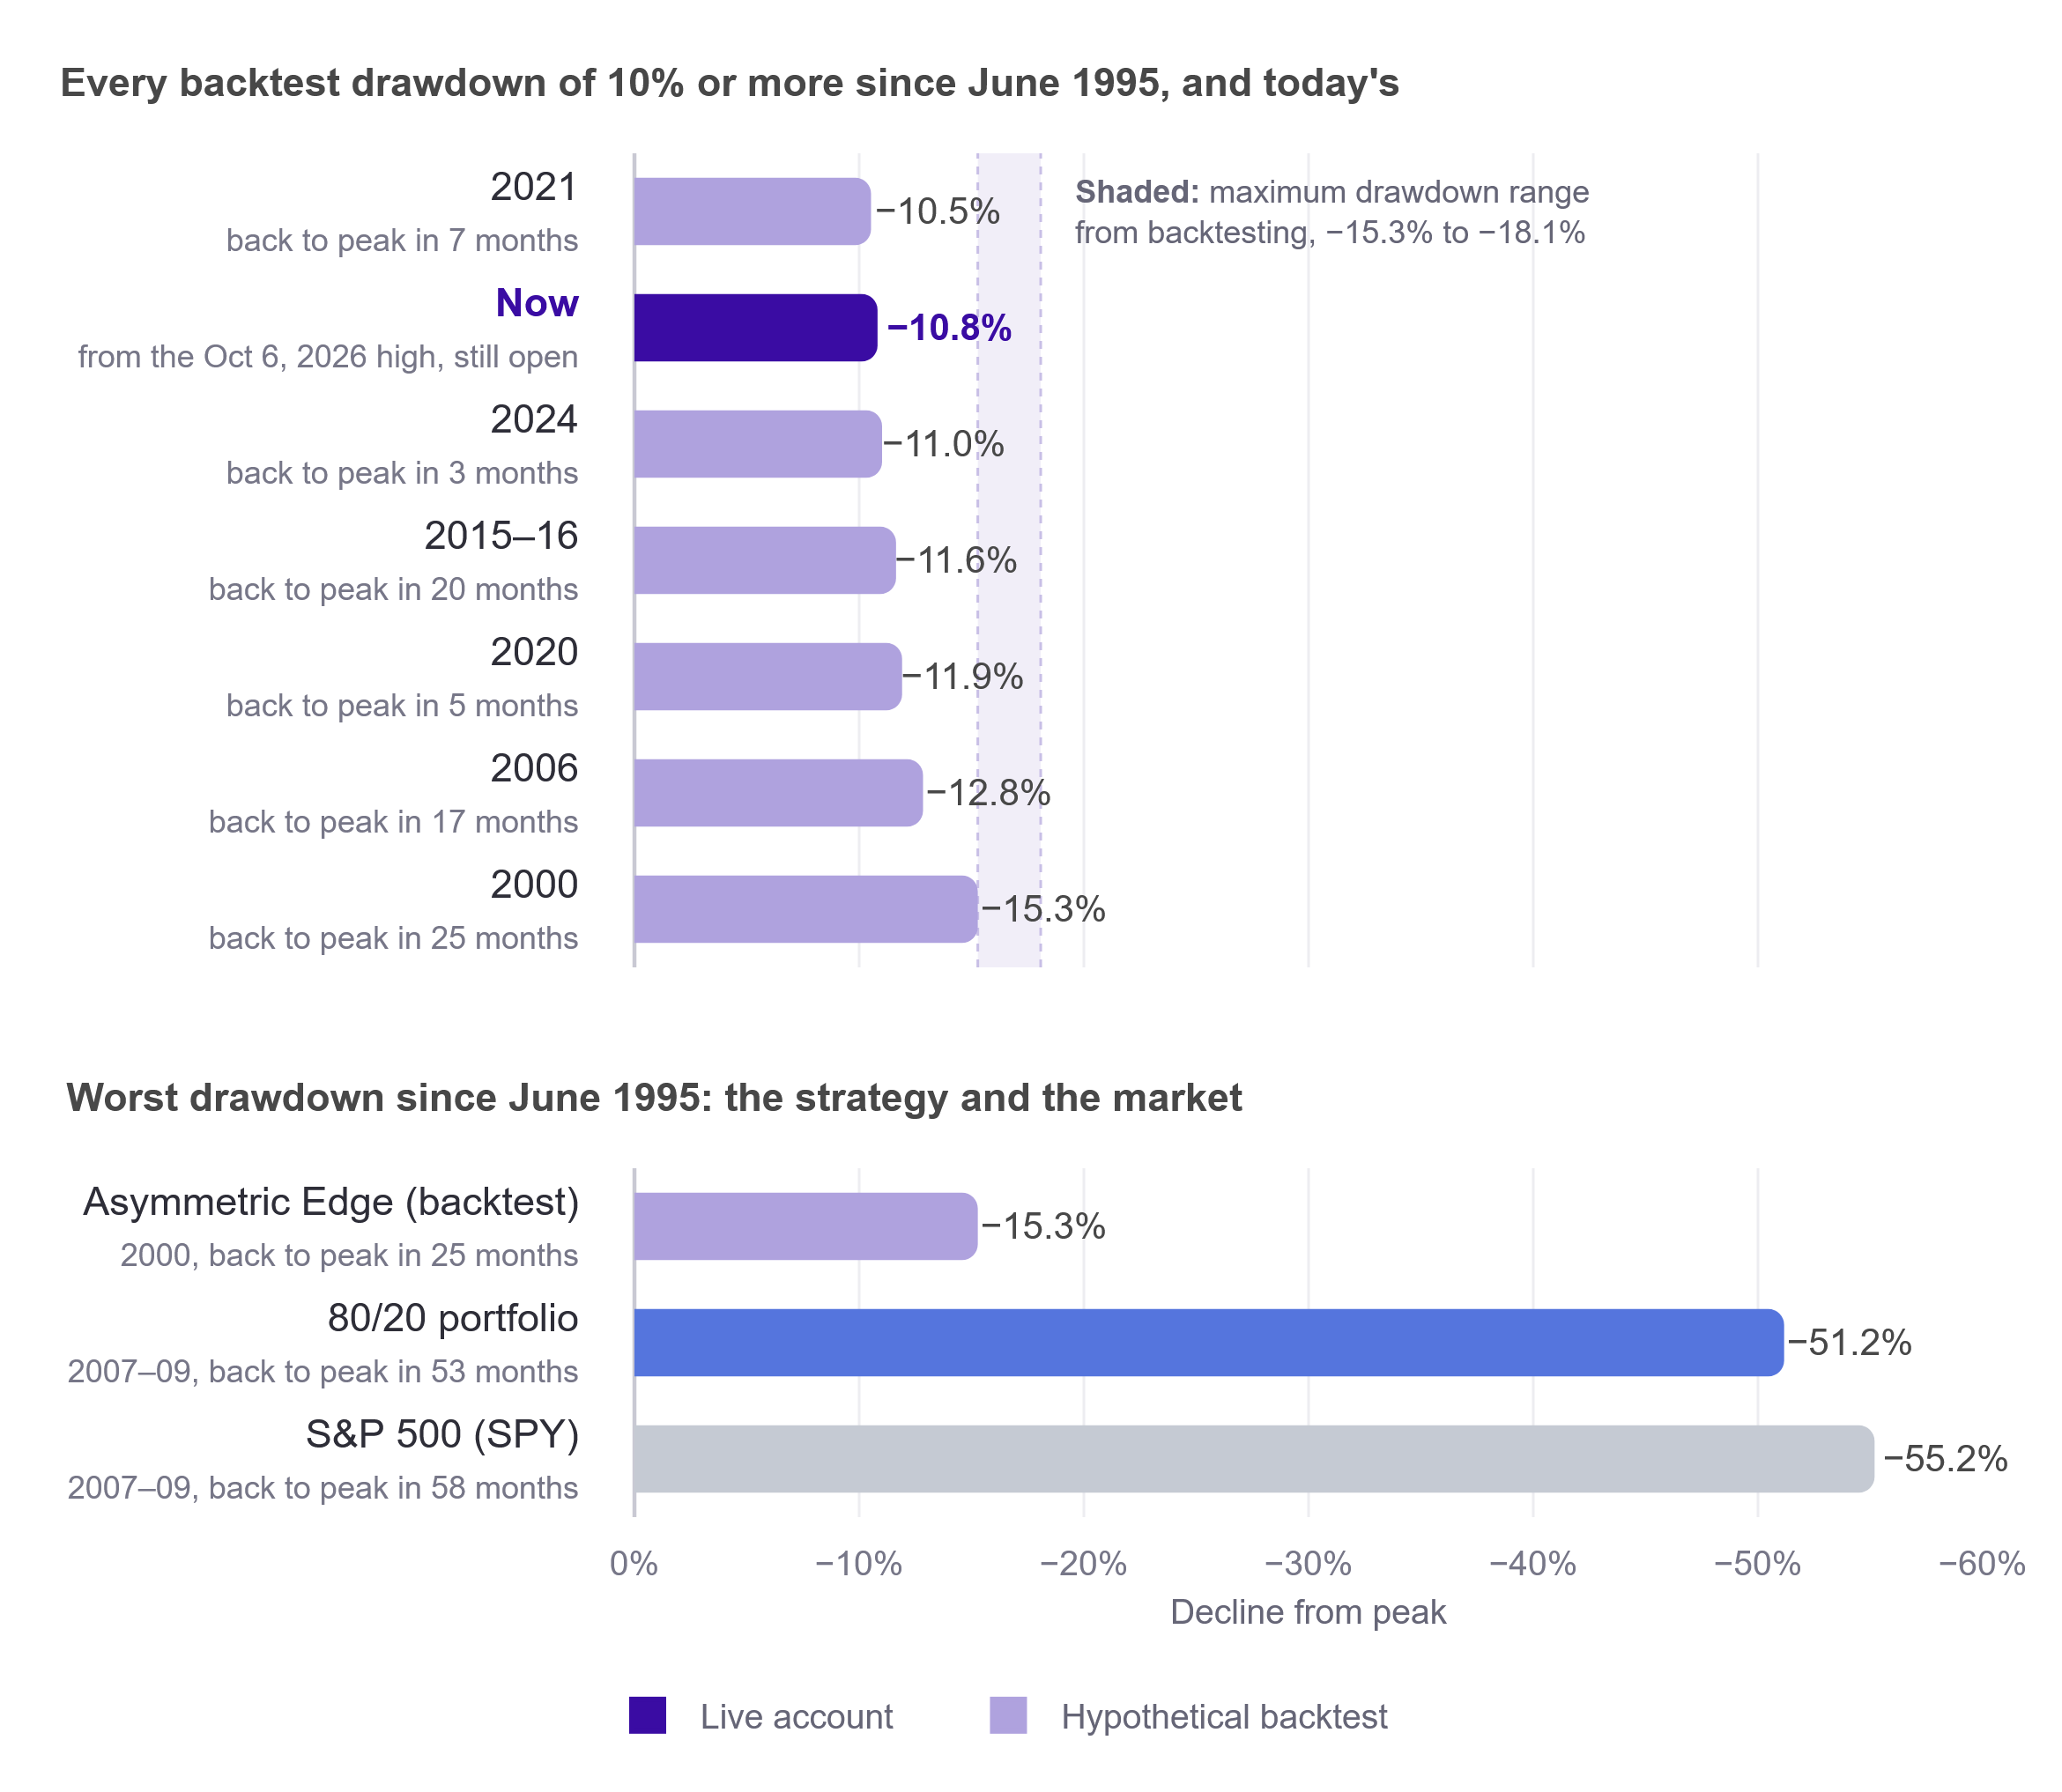
The shaded band shows the worst decline when I reran the test with slightly different settings, such as measuring momentum over shorter or longer periods. Across those reruns, the worst decline ranged from about 15% to 18%. I treat that range as a cautious guide, not a limit on how far the strategy could fall.
Corrections would also have come more often in recent years, with four of the six between 2015 and 2024. I think Bitcoin, which joins the test in 2015, is one reason: it has added to returns but also made corrections more common. One of those four was an 11% decline in 2024, a bit larger than my live account's 9% that year, partly because the test uses today's settings. So far, my live record looks like what the test would lead me to expect.
The 80/20 had eight declines of 10% or more over the same 31 years, and seven went past 15%. Only one of the strategy's six would have, and barely: 15.3%, in 2000. The 80/20's worst was 51.2%, in the 2007 to 2009 bear market, shown at the bottom of the chart.
About the test back to 1995: these are hypothetical results, not my live account, which started January 2nd, 2024. The 80/20's history before June 2009 is reconstructed the same way. Results include estimated trading costs but are before taxes and fees. My October 16th issue used a simplified public version of my strategy with different momentum settings, so its largest decline (about 20%, in 2006) differs from the figures here.
What I'm Watching: The VIX
On a week like this, one number I watch closely is the VIX. Often called Wall Street's fear gauge, it measures how much volatility traders expect from the S&P 500 over the next month. On Thursday it jumped from 16.61 to 28.18, up about 70% in a single day.
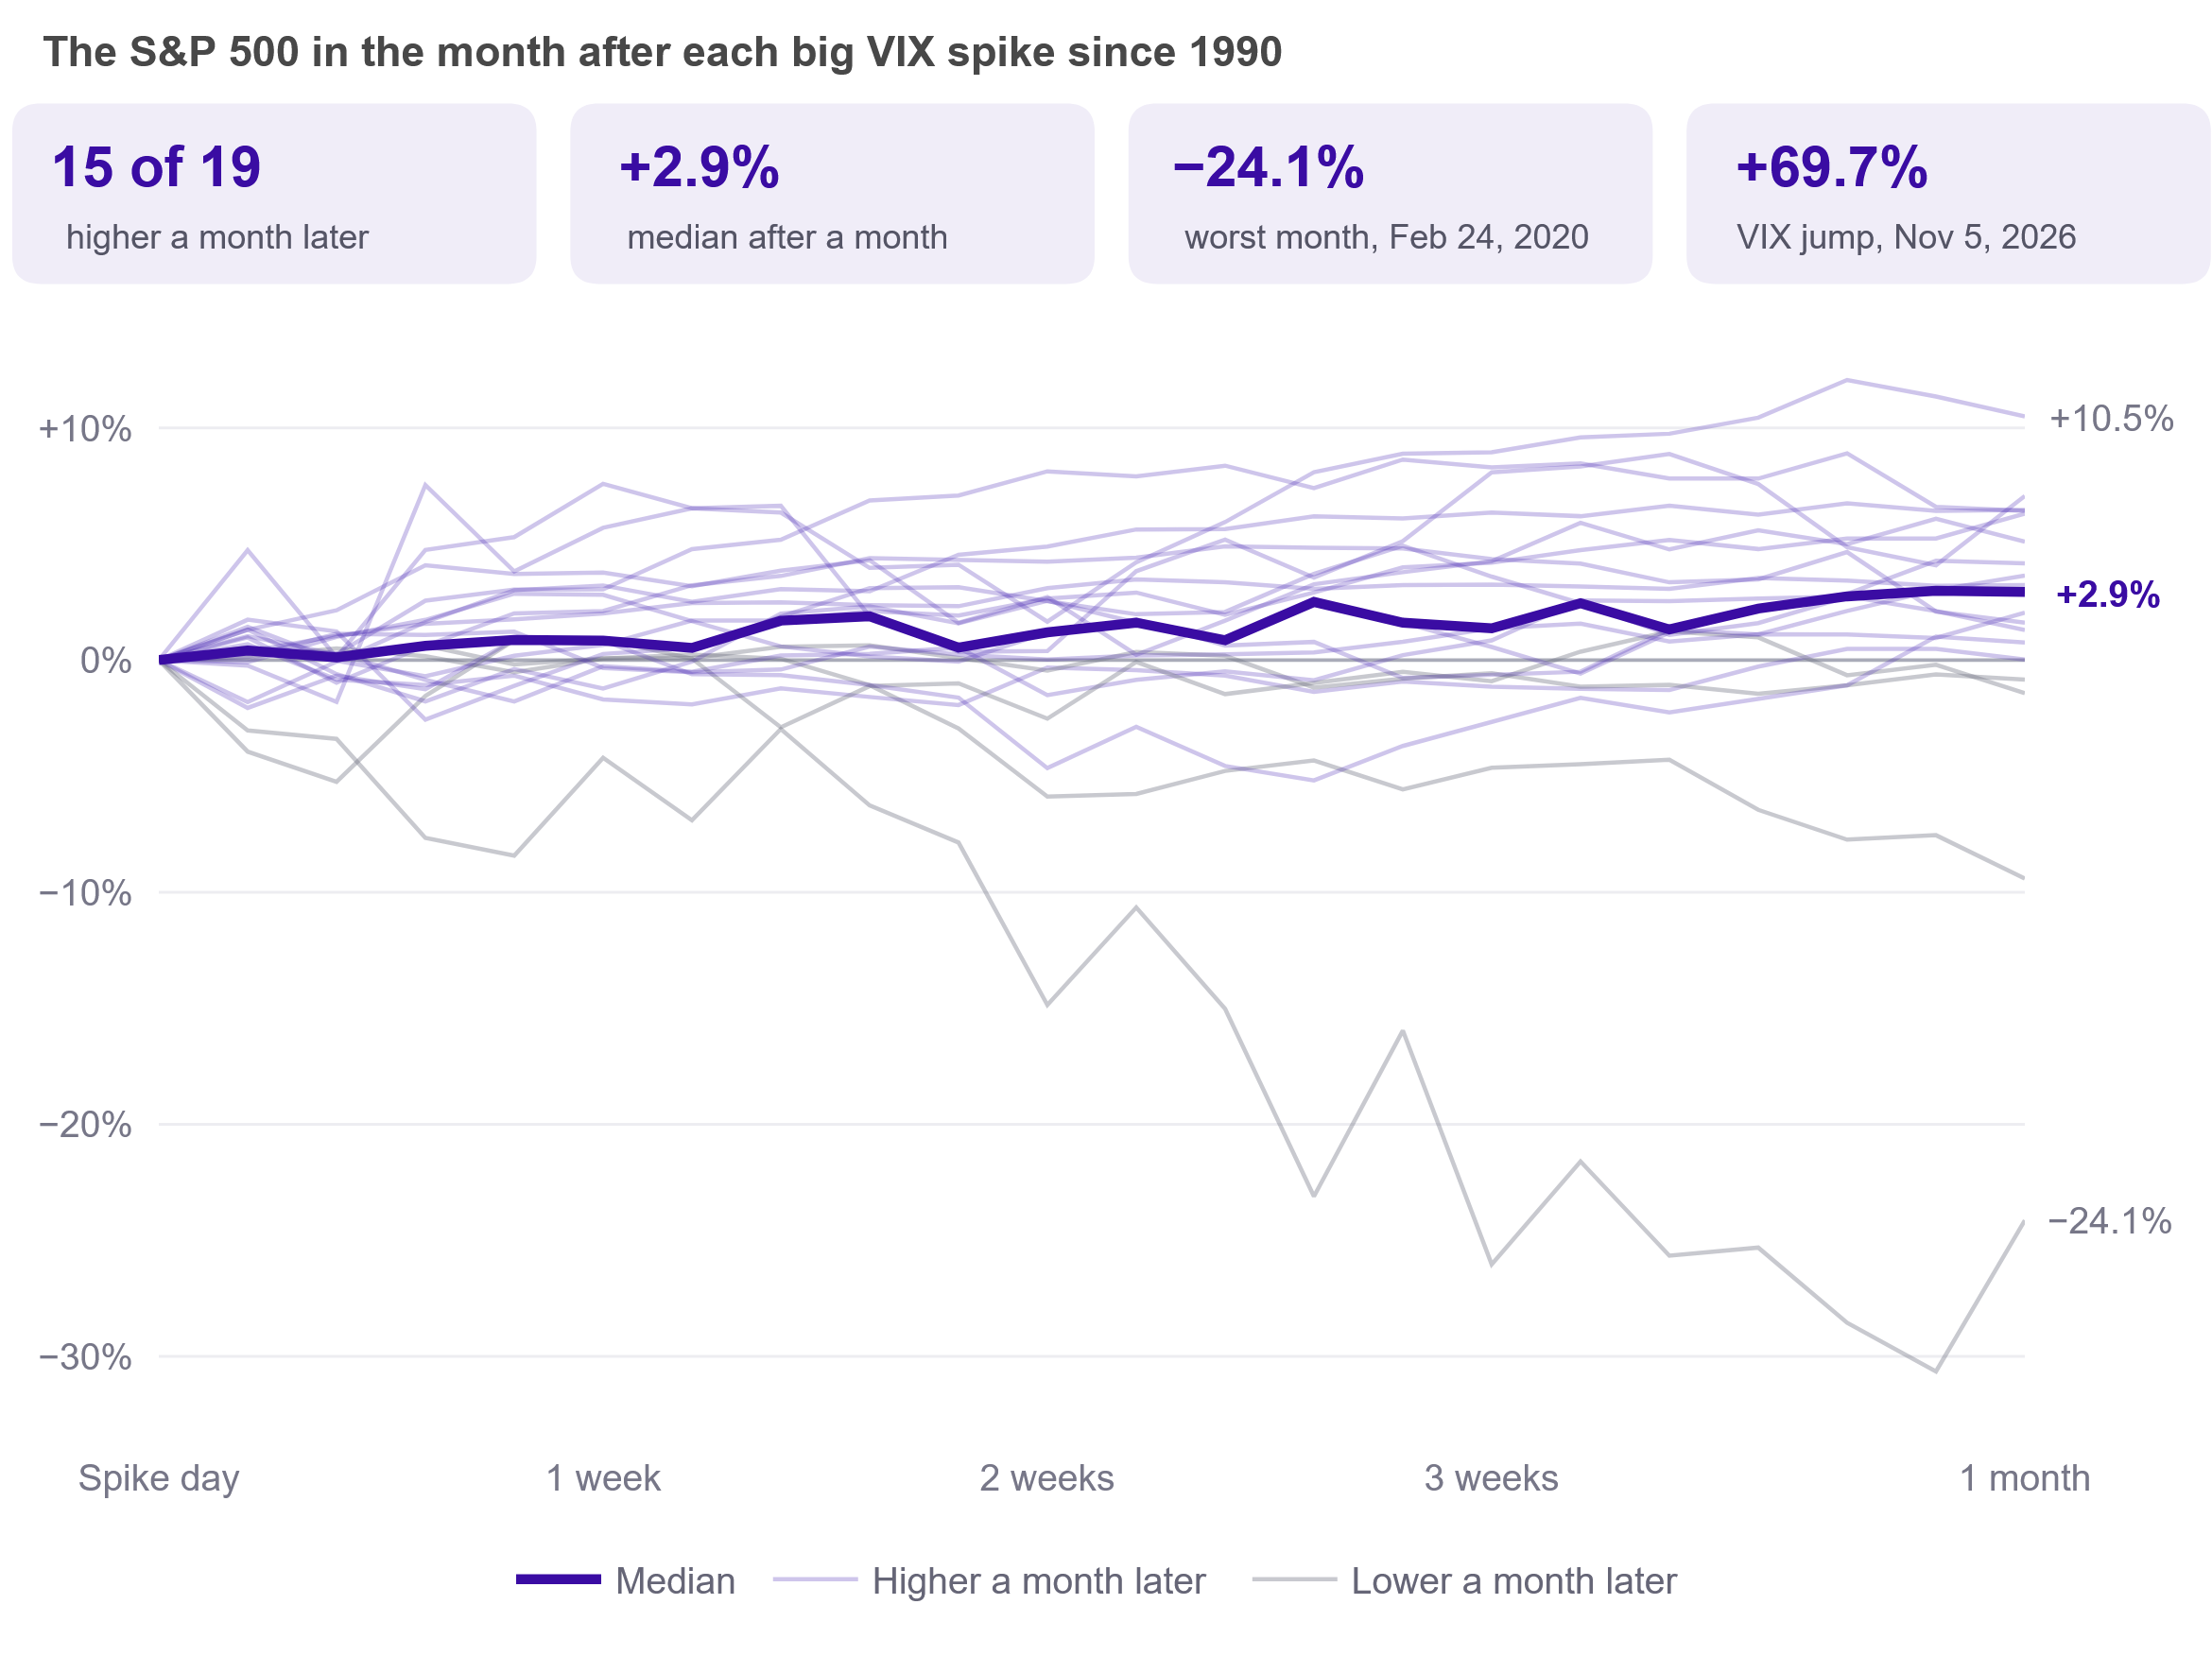
Historically, spikes like this have often come near short-term lows in stocks, though not always. Since 1990, the VIX has jumped 40% or more in a single day 19 times before Thursday. The S&P 500 was higher a month later in 15 of them, with results ranging from a 24.1% loss to a 10.5% gain.
What the S&P 500 Did After Past VIX Spikes
Why does a rebound matter to me? After a sharp selloff, stocks often bounce back partway, and that bounce often comes before the strategy rotates out of stocks and into defensive funds. That's most likely when the selloff hits early or in the middle of a month, like this one. Unless its momentum turns around, the Nasdaq-100 will very likely leave my portfolio at the end of the month. A bounce before then could let me exit above Thursday’s lows.
The VIX history backs this up. After a spike, the S&P 500 often fell further before it bottomed. Still, in 15 of the 19 cases, its close at the end of that month was above its lowest close after the spike, typically by about 2%. The big exception was 2020, when the S&P 500 ended February at its low, then fell into a bear market in March.
What the Nasdaq-100 Did After Past VXN Spikes
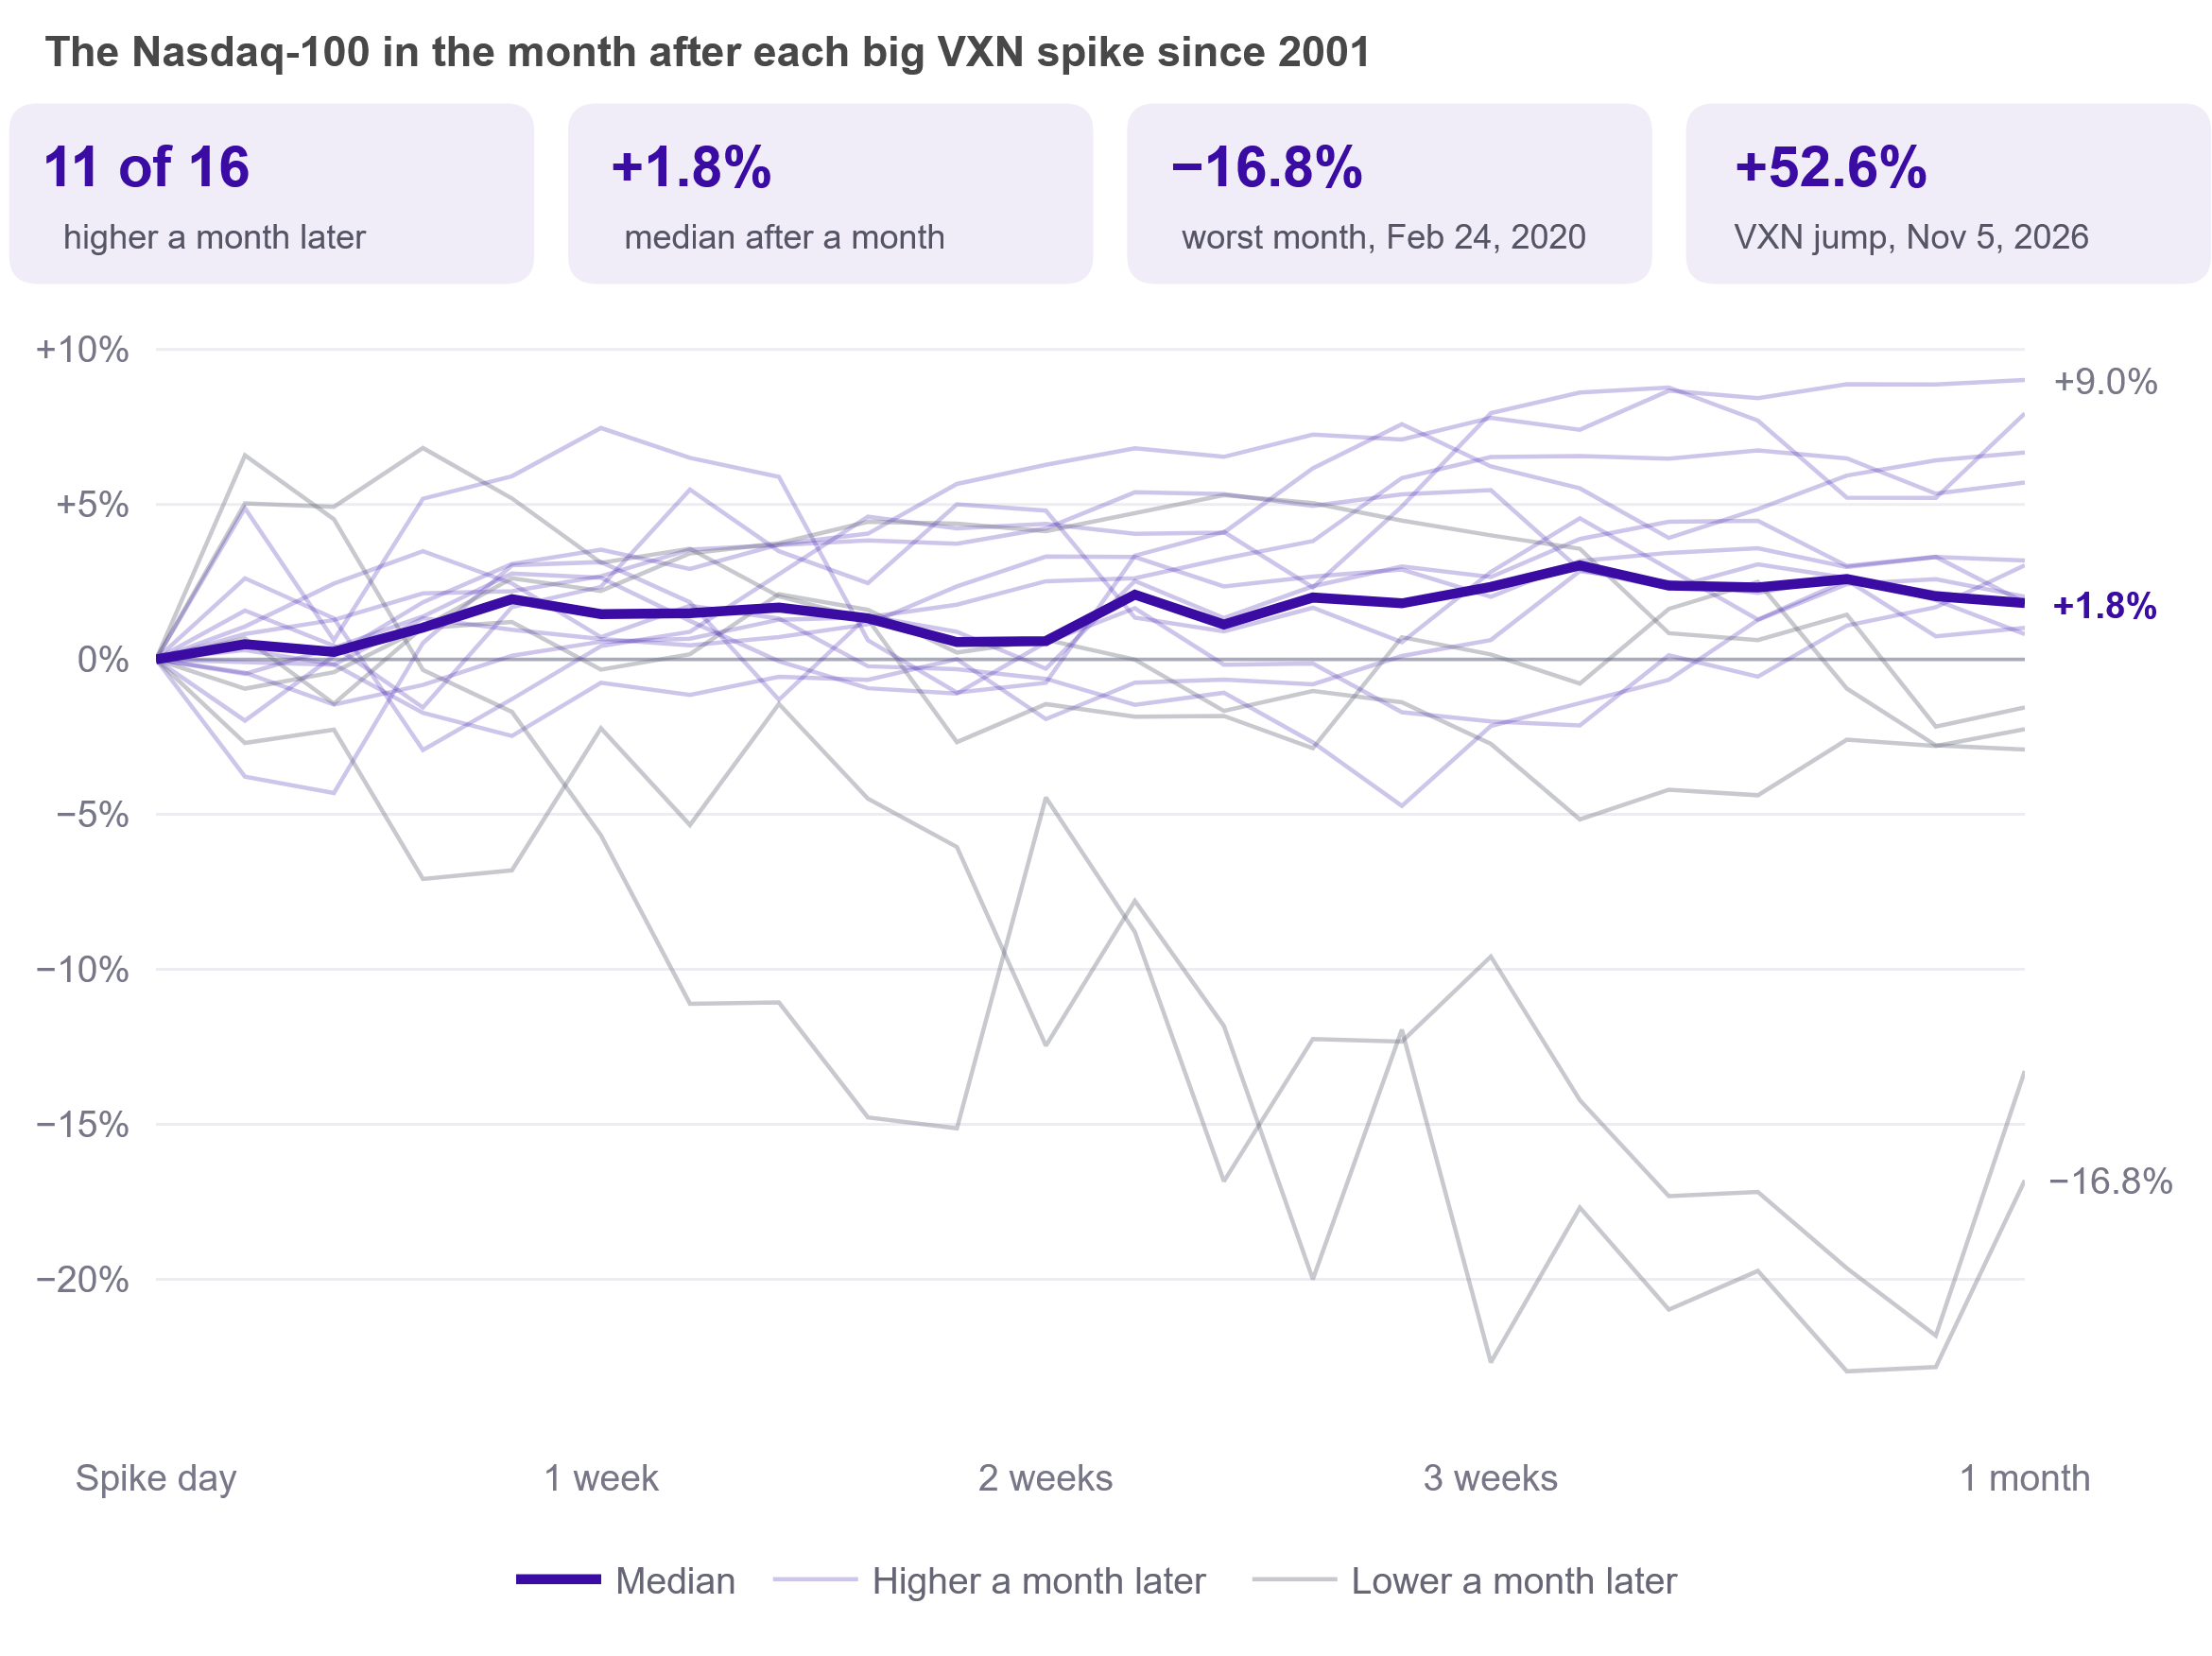
The Nasdaq-100 has its own version of the VIX, called the VXN. It jumped 53% on Thursday, its third-largest one-day increase since 2001. After the 16 previous jumps of 30% or more, the Nasdaq-100 was higher a month later 11 times, with results ranging from a 16.8% loss to a 9.0% gain.
Like the S&P 500, it often fell further before rebounding. Still, in 13 of the 16 cases, it ended that month above its lowest close after the VXN spike, typically by about 3%.
The November 30th Rebalance
Each month, my strategy ranks ten ETFs by their medium-term momentum and holds the four strongest. A few bad weeks in October weren't enough to push the Nasdaq-100 or Bitcoin out, because none of the defensive funds were stronger. If my stock funds and Bitcoin fall behind them by November 30th, gold, T-bills, or defensive equity (ticker BTAL, which buys stocks that move less than the market and bets against those that move more) could take their place.
Only trading once a month has a cost: a sharp decline can hit before the strategy adjusts. That's how the test's worst decline happened, a 15.3% loss in the first weeks of the dot-com crash. Once it moved into T-bills and other defensive funds, though, it would have sat out the rest. While the Nasdaq-100 lost about 83% from its March 2000 peak to its October 2002 low, the strategy would have gained about 11%.
Is today's AI spending a bubble? I don't know, and I don't need to. The same goes for what the midterm election results mean for markets, since the strategy follows price trends, not headlines.
Watching the Nasdaq-100 plummet more than 6% in a day, just a week after my strategy's worst month, is hard to sit through. But my rules exist for exactly this. They make the decision, so I don't have to.
You'll hear from me next in my regular mid-month issue, around November 15th to 17th, and again after the November 30th rebalance.
Thanks for reading.

Disclaimer & Disclosure
This newsletter is for informational purposes only and does not constitute financial advice, investment recommendations, or an offer to sell or buy any securities. The content is published as a journal of the author's personal investment activities and is intended for a general audience.
No Investment Advice: The author is not a financial advisor. You should not treat any opinion expressed herein as a specific inducement to make a particular investment or follow a particular strategy, but only as an expression of opinion.
Risk Warning: Investment involves risk, including the possible loss of principal. Past performance is not indicative of future results. No investment strategy or risk management technique can guarantee returns or eliminate risk in any market environment.
Data & Accuracy: Information contained herein has been obtained from sources believed to be reliable, but its accuracy and completeness are not guaranteed. All expressions of opinion are subject to change without notice in reaction to shifting market conditions.
Positions: The author currently holds positions in the securities mentioned in this newsletter. The author may buy or sell these securities at any time without notice.
Copyright: This content is provided solely for the personal use of the subscriber. Any unauthorized copying, forwarding, or distribution of this material is prohibited without prior written consent.