If the AI Bubble Bursts, This Is How My Strategy Would Adapt
October's AI selloff hit two of my four positions, though the strategy is still up 25.9% this year against 10.2% for an 80/20 portfolio. Inside: how much of my portfolio rides on AI, and how my strategy would adapt if the bubble bursts.


The Asymmetric Edge strategy is up 25.9% year-to-date through October 15, against 10.2% for an 80/20 portfolio, but October has started in the red. Two of my four positions sold off with the AI trade this month, and Korea's stock market hit a circuit breaker on Thursday.
This issue covers what hit the Nasdaq-100 and emerging markets, why commodities carried the month, and a hot inflation report that put another Fed hike on the table. All four positions were set at the September 30 rebalance and are unchanged since. The deep dive looks at how much of my portfolio actually rides on AI, and how my strategy would adapt if the selloff turns into something bigger.
📌 This newsletter documents how I invest my own money with a simple, rules-based strategy. The aim is to match a traditional balanced portfolio with shallower drawdowns, and I share what I hold and why so you can watch it play out.
What Moved
- 🌏 Korean stocks fell hard. The Kospi dropped 5.46% on October 13 as chipmakers sold off, then fell 7.57% on Thursday after setting off a trading halt.
- 🤖 Doubts about AI spending grew. OpenAI's annualized revenue came in near $50 billion, below the roughly $70 billion reported in September, and AI stocks fell even though the gap was mostly about accounting.
- 🌡️ Inflation came in hot. Consumer prices rose 3.7% from a year earlier in September, and the odds of another Fed hike on October 28 roughly doubled.
- 🛢️ Oil climbed past $106. Brent crude settled at $106.06 on Wednesday as attacks on tankers in the Strait of Hormuz picked up.
🏷️ Theme of the Month: Priced for Perfection
A stock is priced for perfection when its price already assumes nearly everything goes right. At that point, good news has to beat what people hoped for, or the stock can fall anyway. That's where AI stocks were this month. A revenue figure that looked smaller mostly because of accounting was enough to knock them down.
💰 One Number That Matters: $50 Billion
OpenAI's annualized revenue as of late September, according to CNBC. Figures of roughly $70 billion had circulated a few weeks earlier, but those counted the full value of sales made through partner companies.
CNBC's source said the gap didn't reflect lost sales. Nvidia, Oracle, and CoreWeave fell anyway on October 8. It's the clearest example of priced for perfection I saw all month.
Market Moves
Portfolio and Benchmark Returns
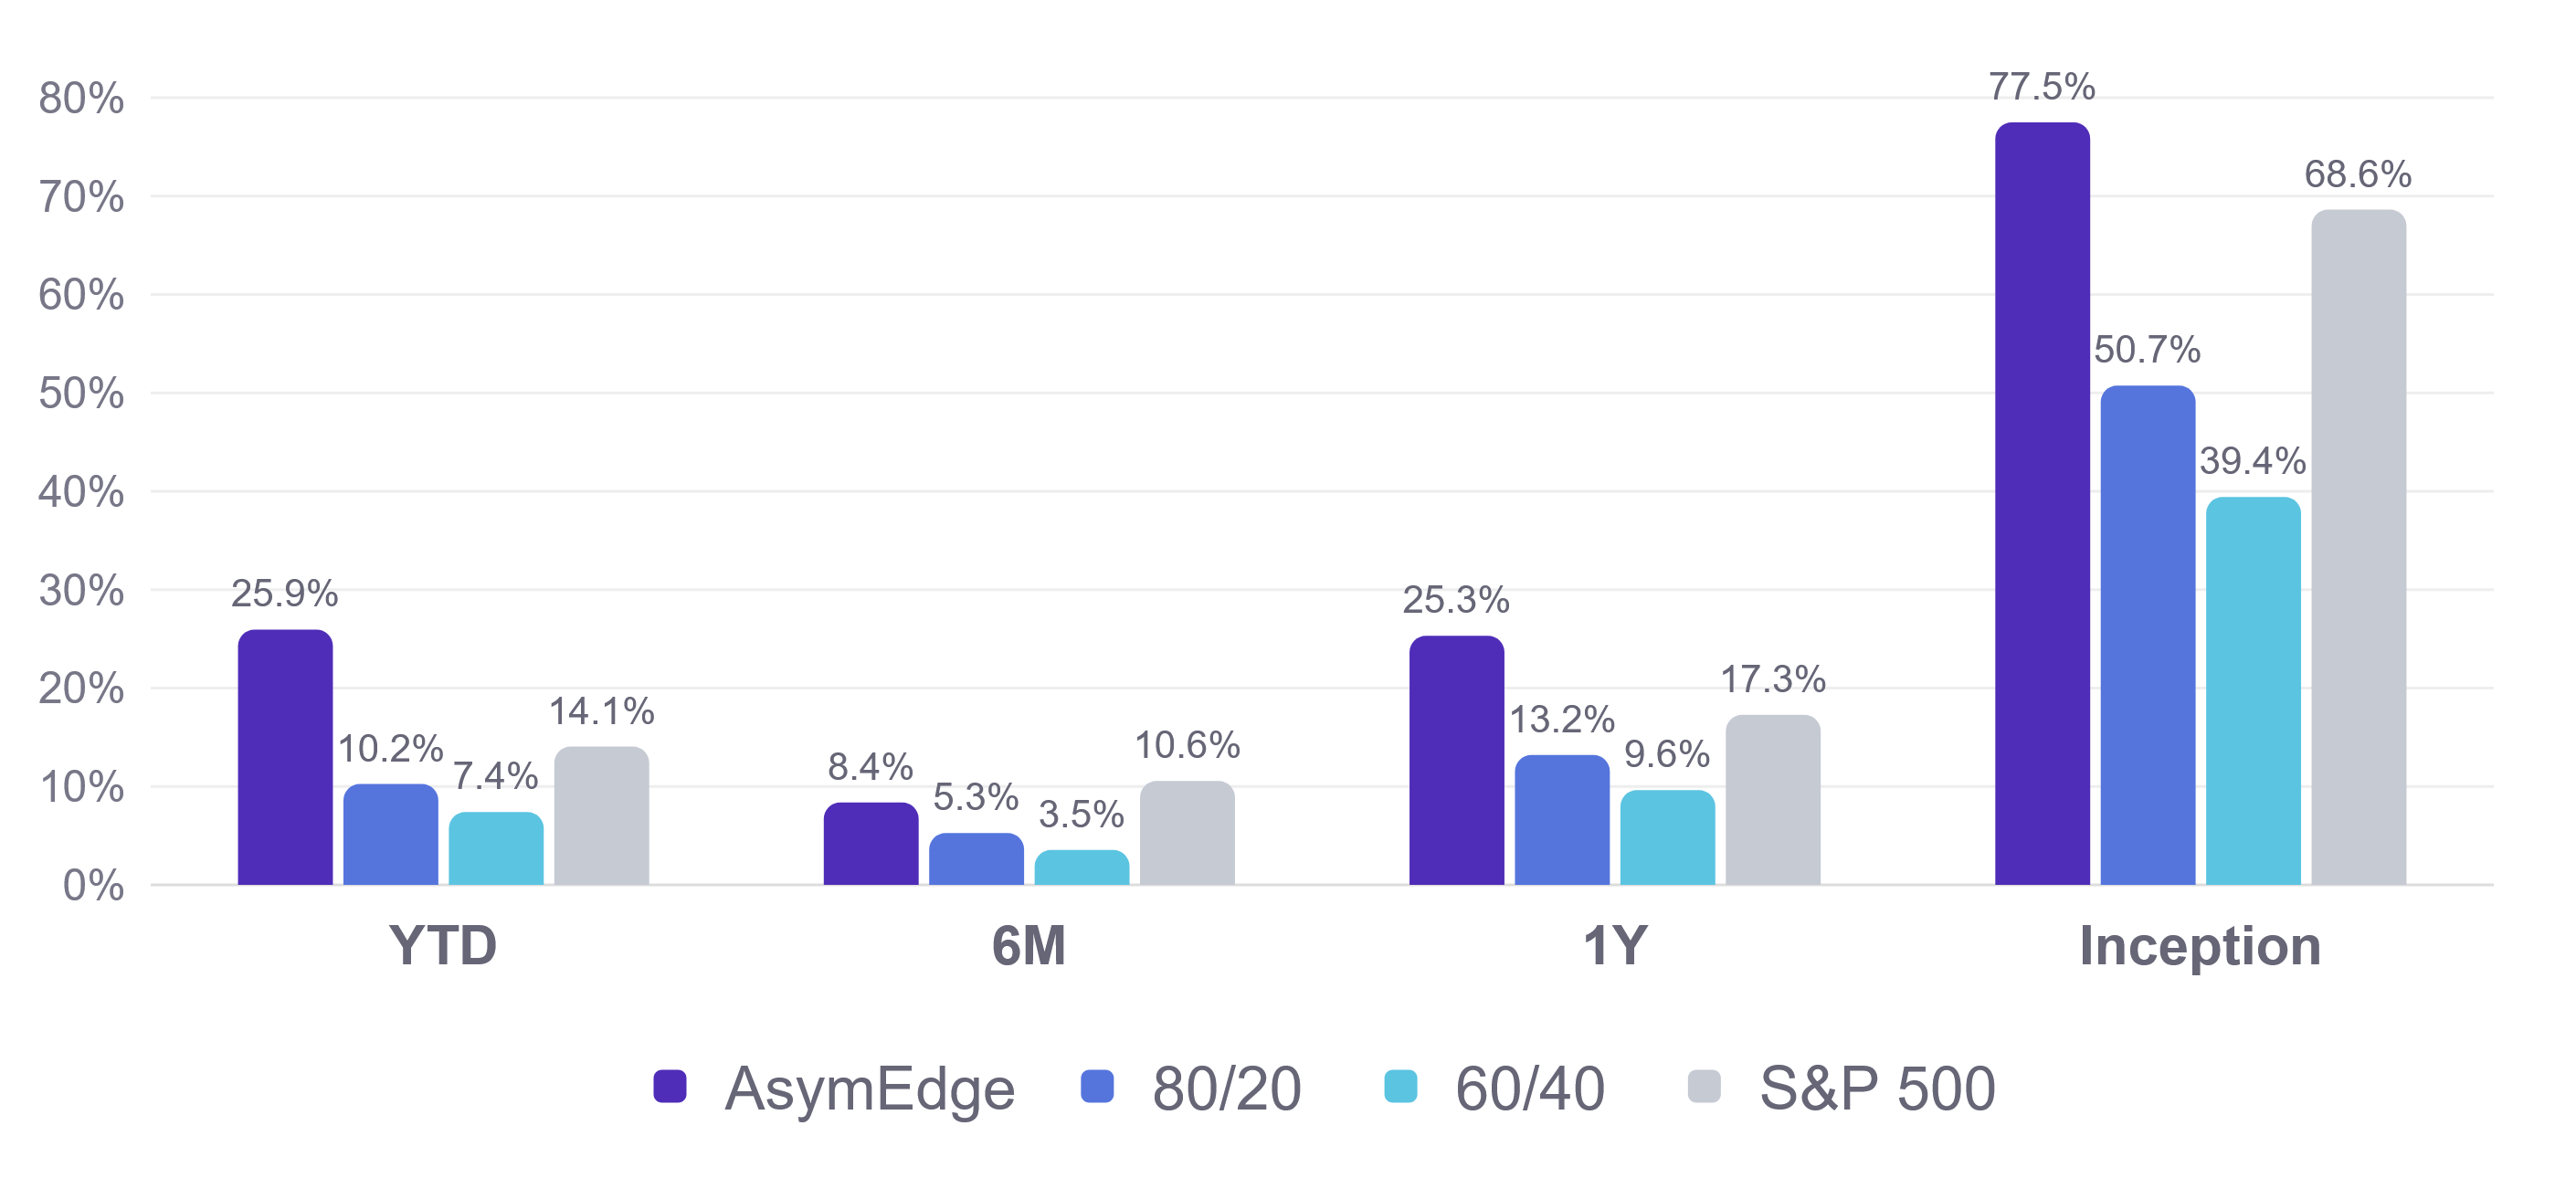
October has started in the red. Through Thursday the strategy is down 1.05% for the month, against gains of 0.49% for the 80/20 portfolio and 1.20% for the S&P 500. Most of that came this week, when tech stocks and emerging markets sold off together. The strategy fell 1.57% on Wednesday and another 0.36% on Thursday.
The S&P 500 still leads over six months, 10.6% to 8.4%. Over every other period the strategy is ahead of all three benchmarks.
Maximum Drawdown
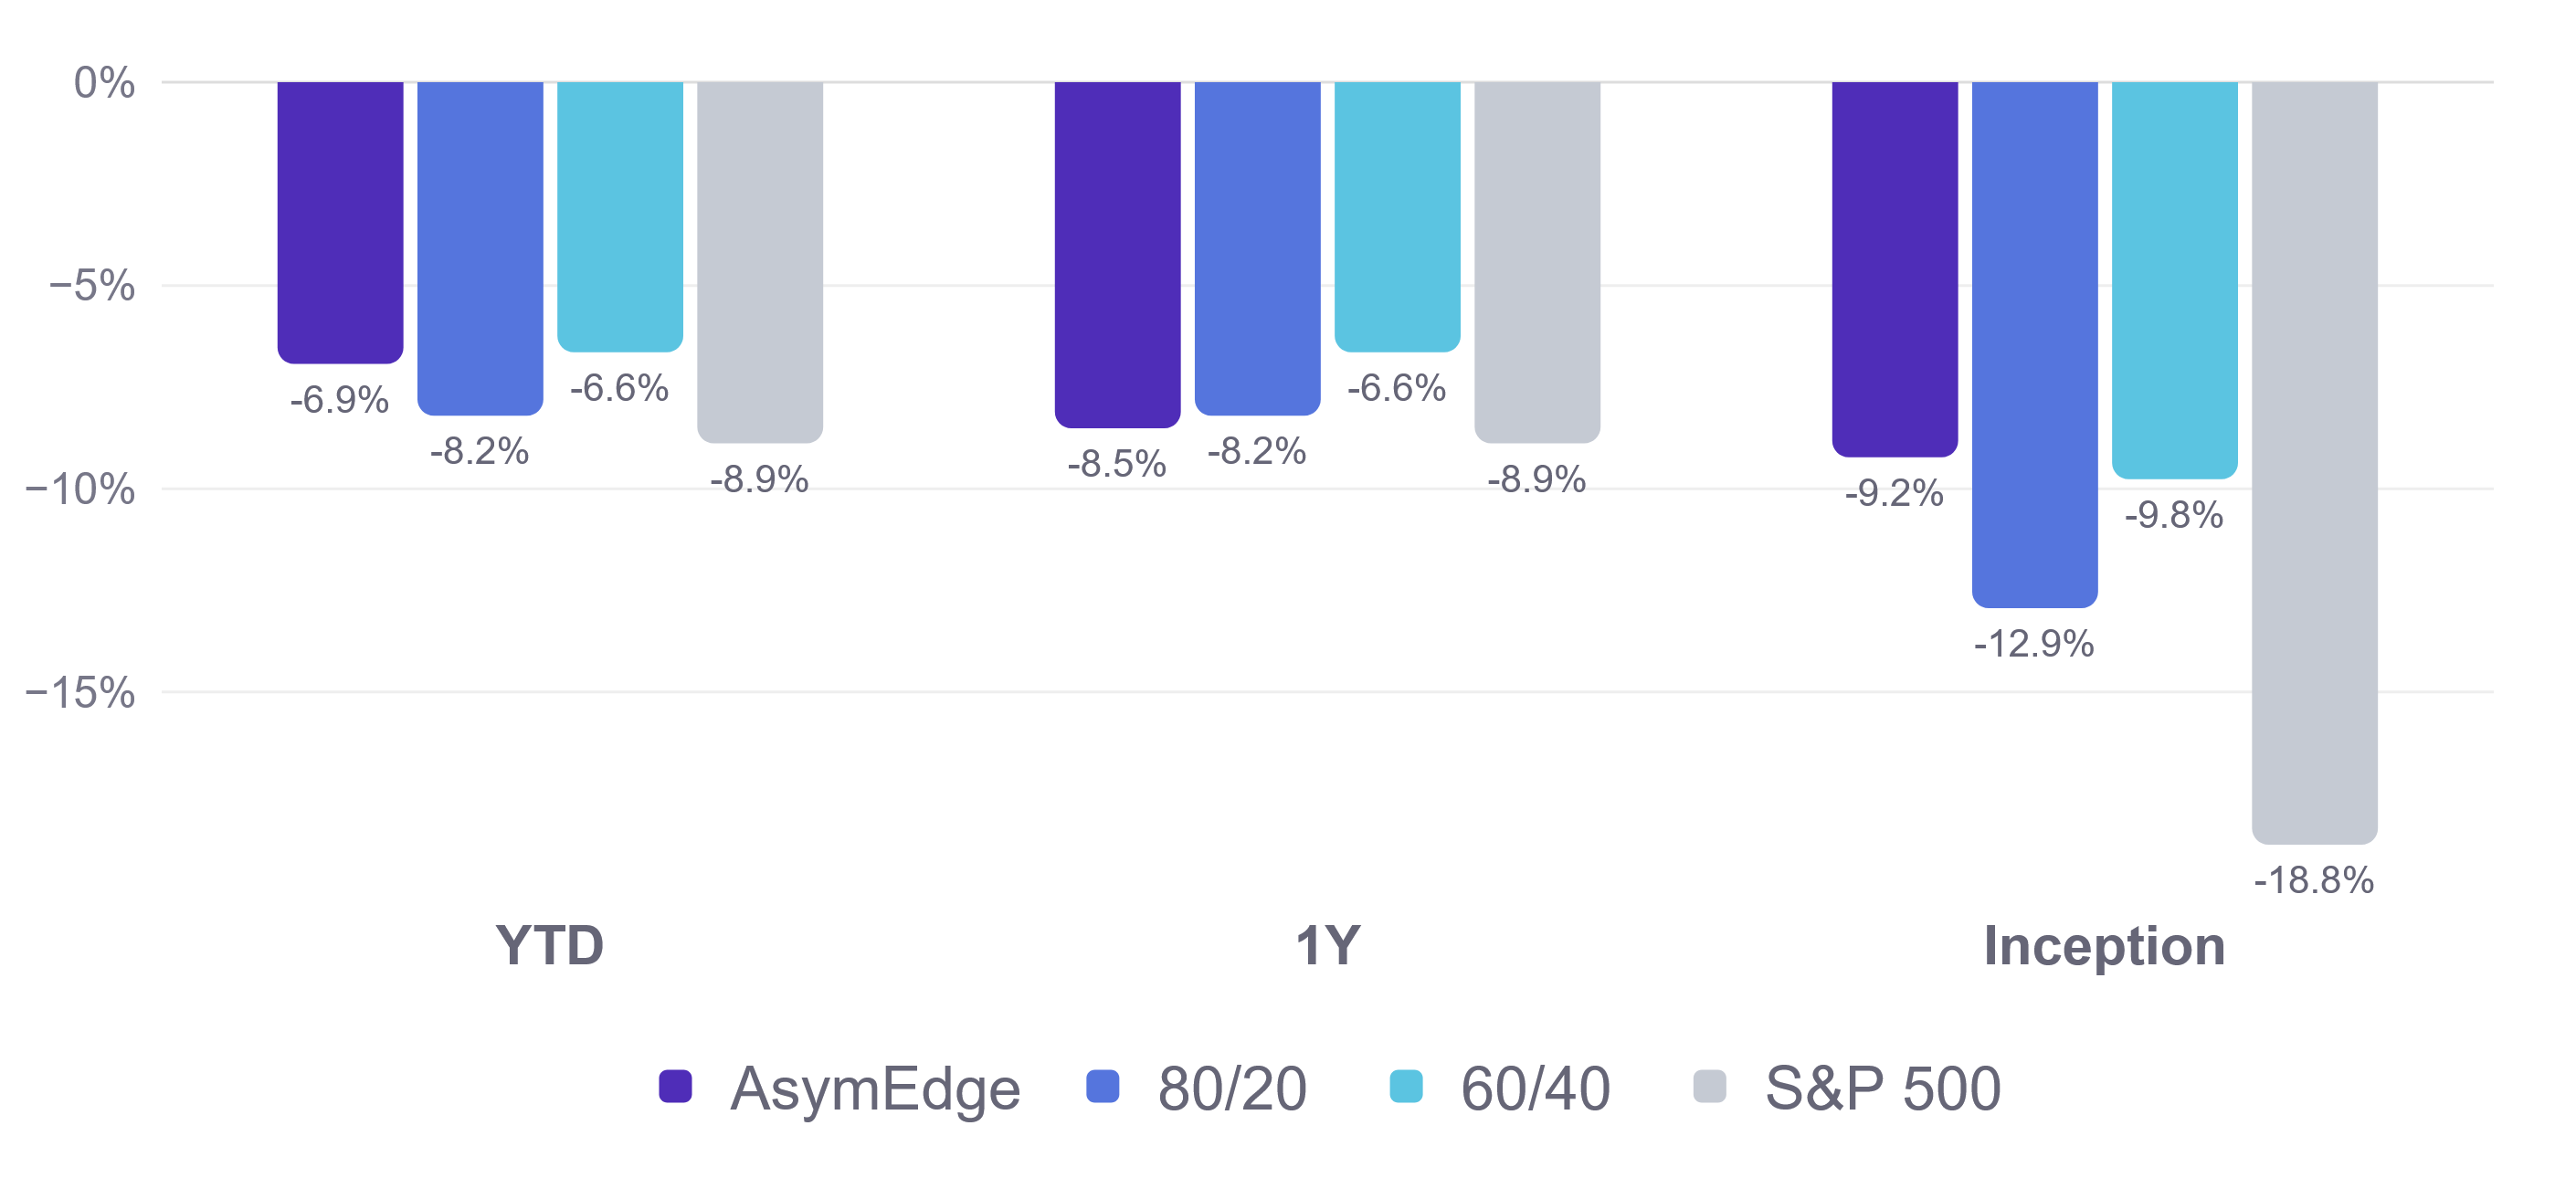
Maximum drawdown is the largest drop from a high point to a later low, and keeping it shallow is half of my goal. Since going live in January 2024, the strategy's worst drop was 9.2%, in mid-2024, against 12.9% for the 80/20 portfolio and 18.8% for the S&P 500.
Those benchmark drops all came in the spring 2025 tariff selloff, when my portfolio sat in T-bills for most of it. Over the past year, the strategy's worst drop was about even with the 80/20 portfolio's, 8.5% to 8.2%, and this year it's been a little shallower, 6.9% to 8.2%.
Year-to-Date Growth of $10,000
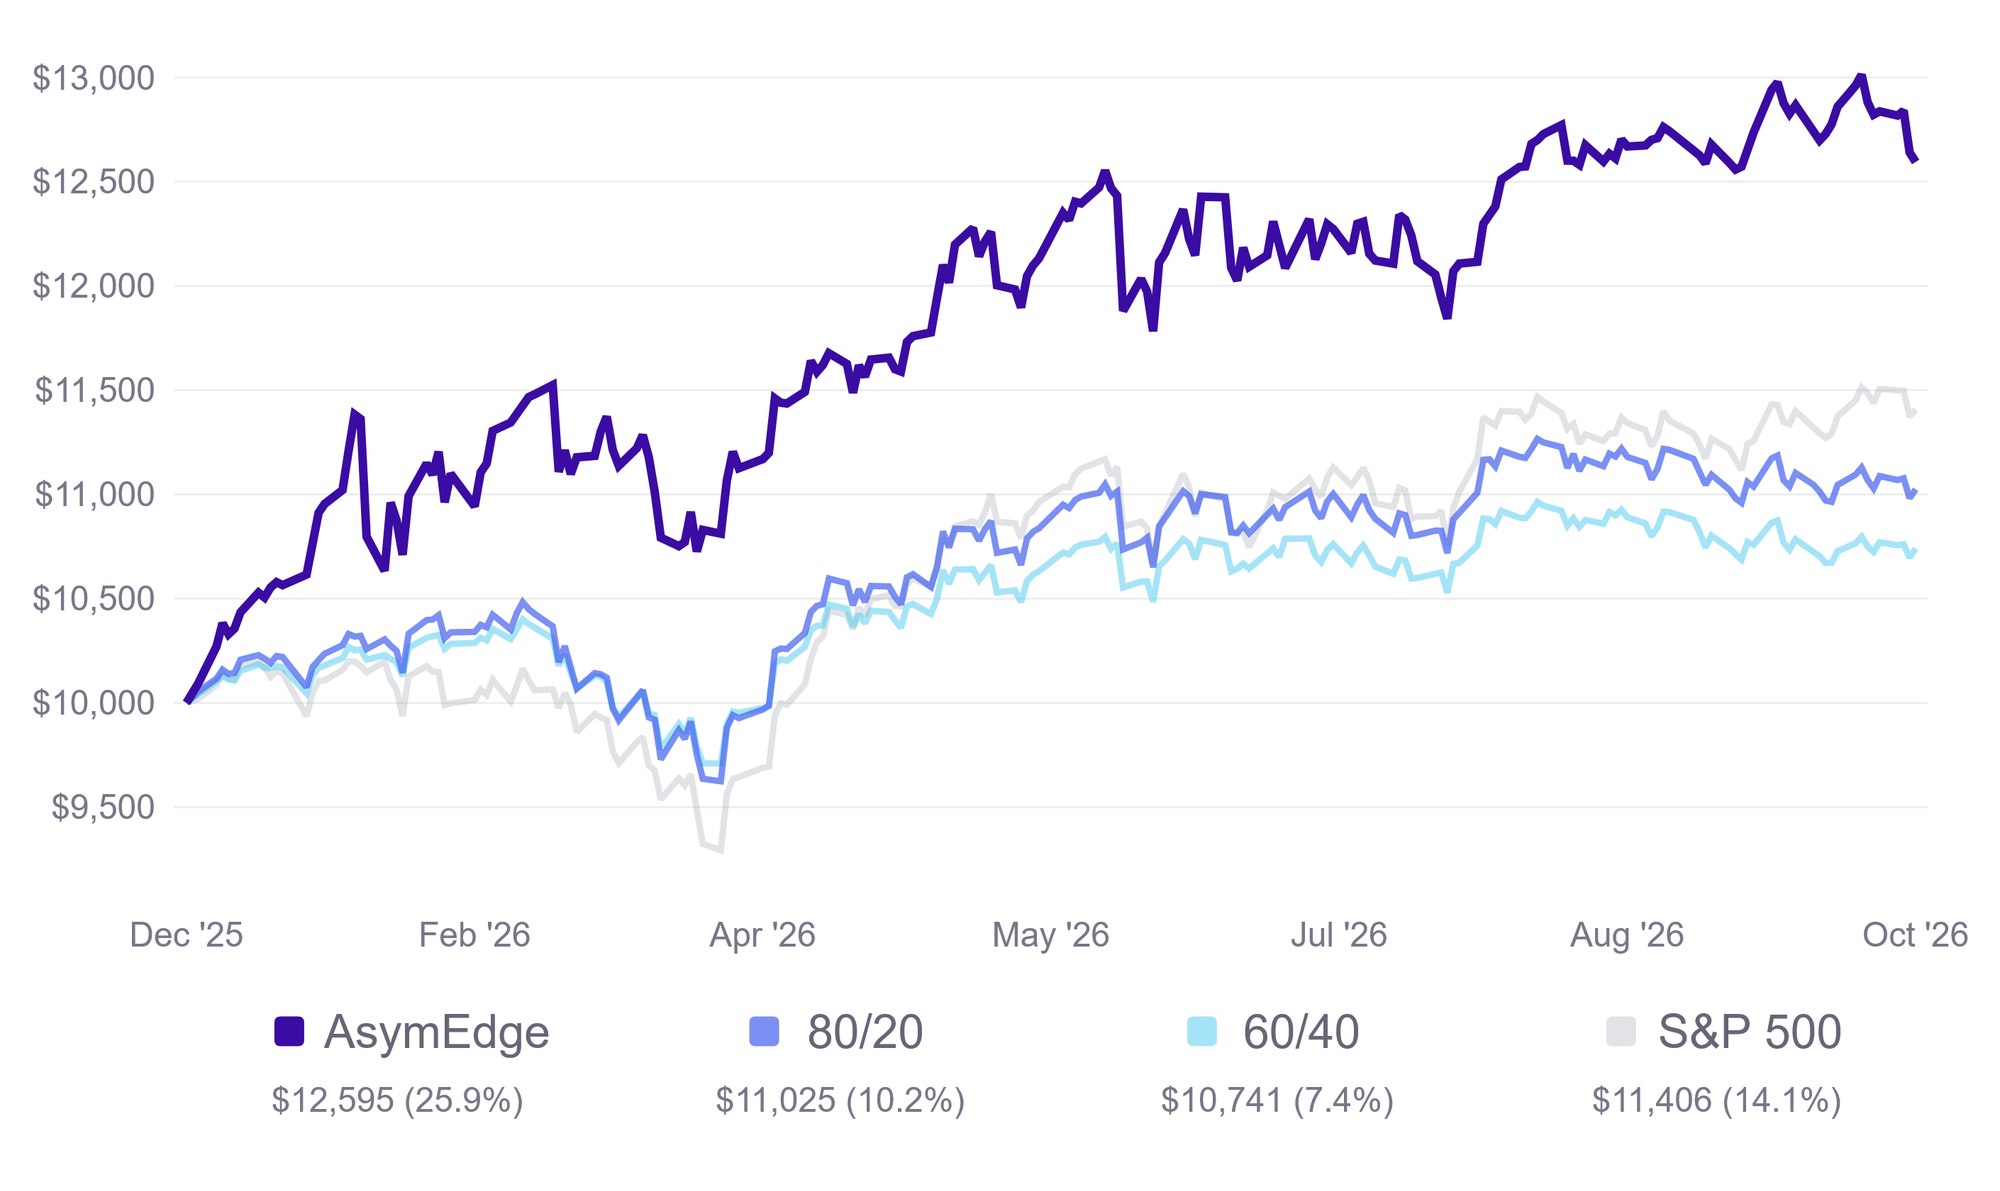
Ten thousand dollars invested in the strategy at the start of the year would be worth about $12,595 through Thursday, against $11,406 in the S&P 500 and $11,025 in an 80/20 portfolio.
Year-to-Date Asset Class Returns
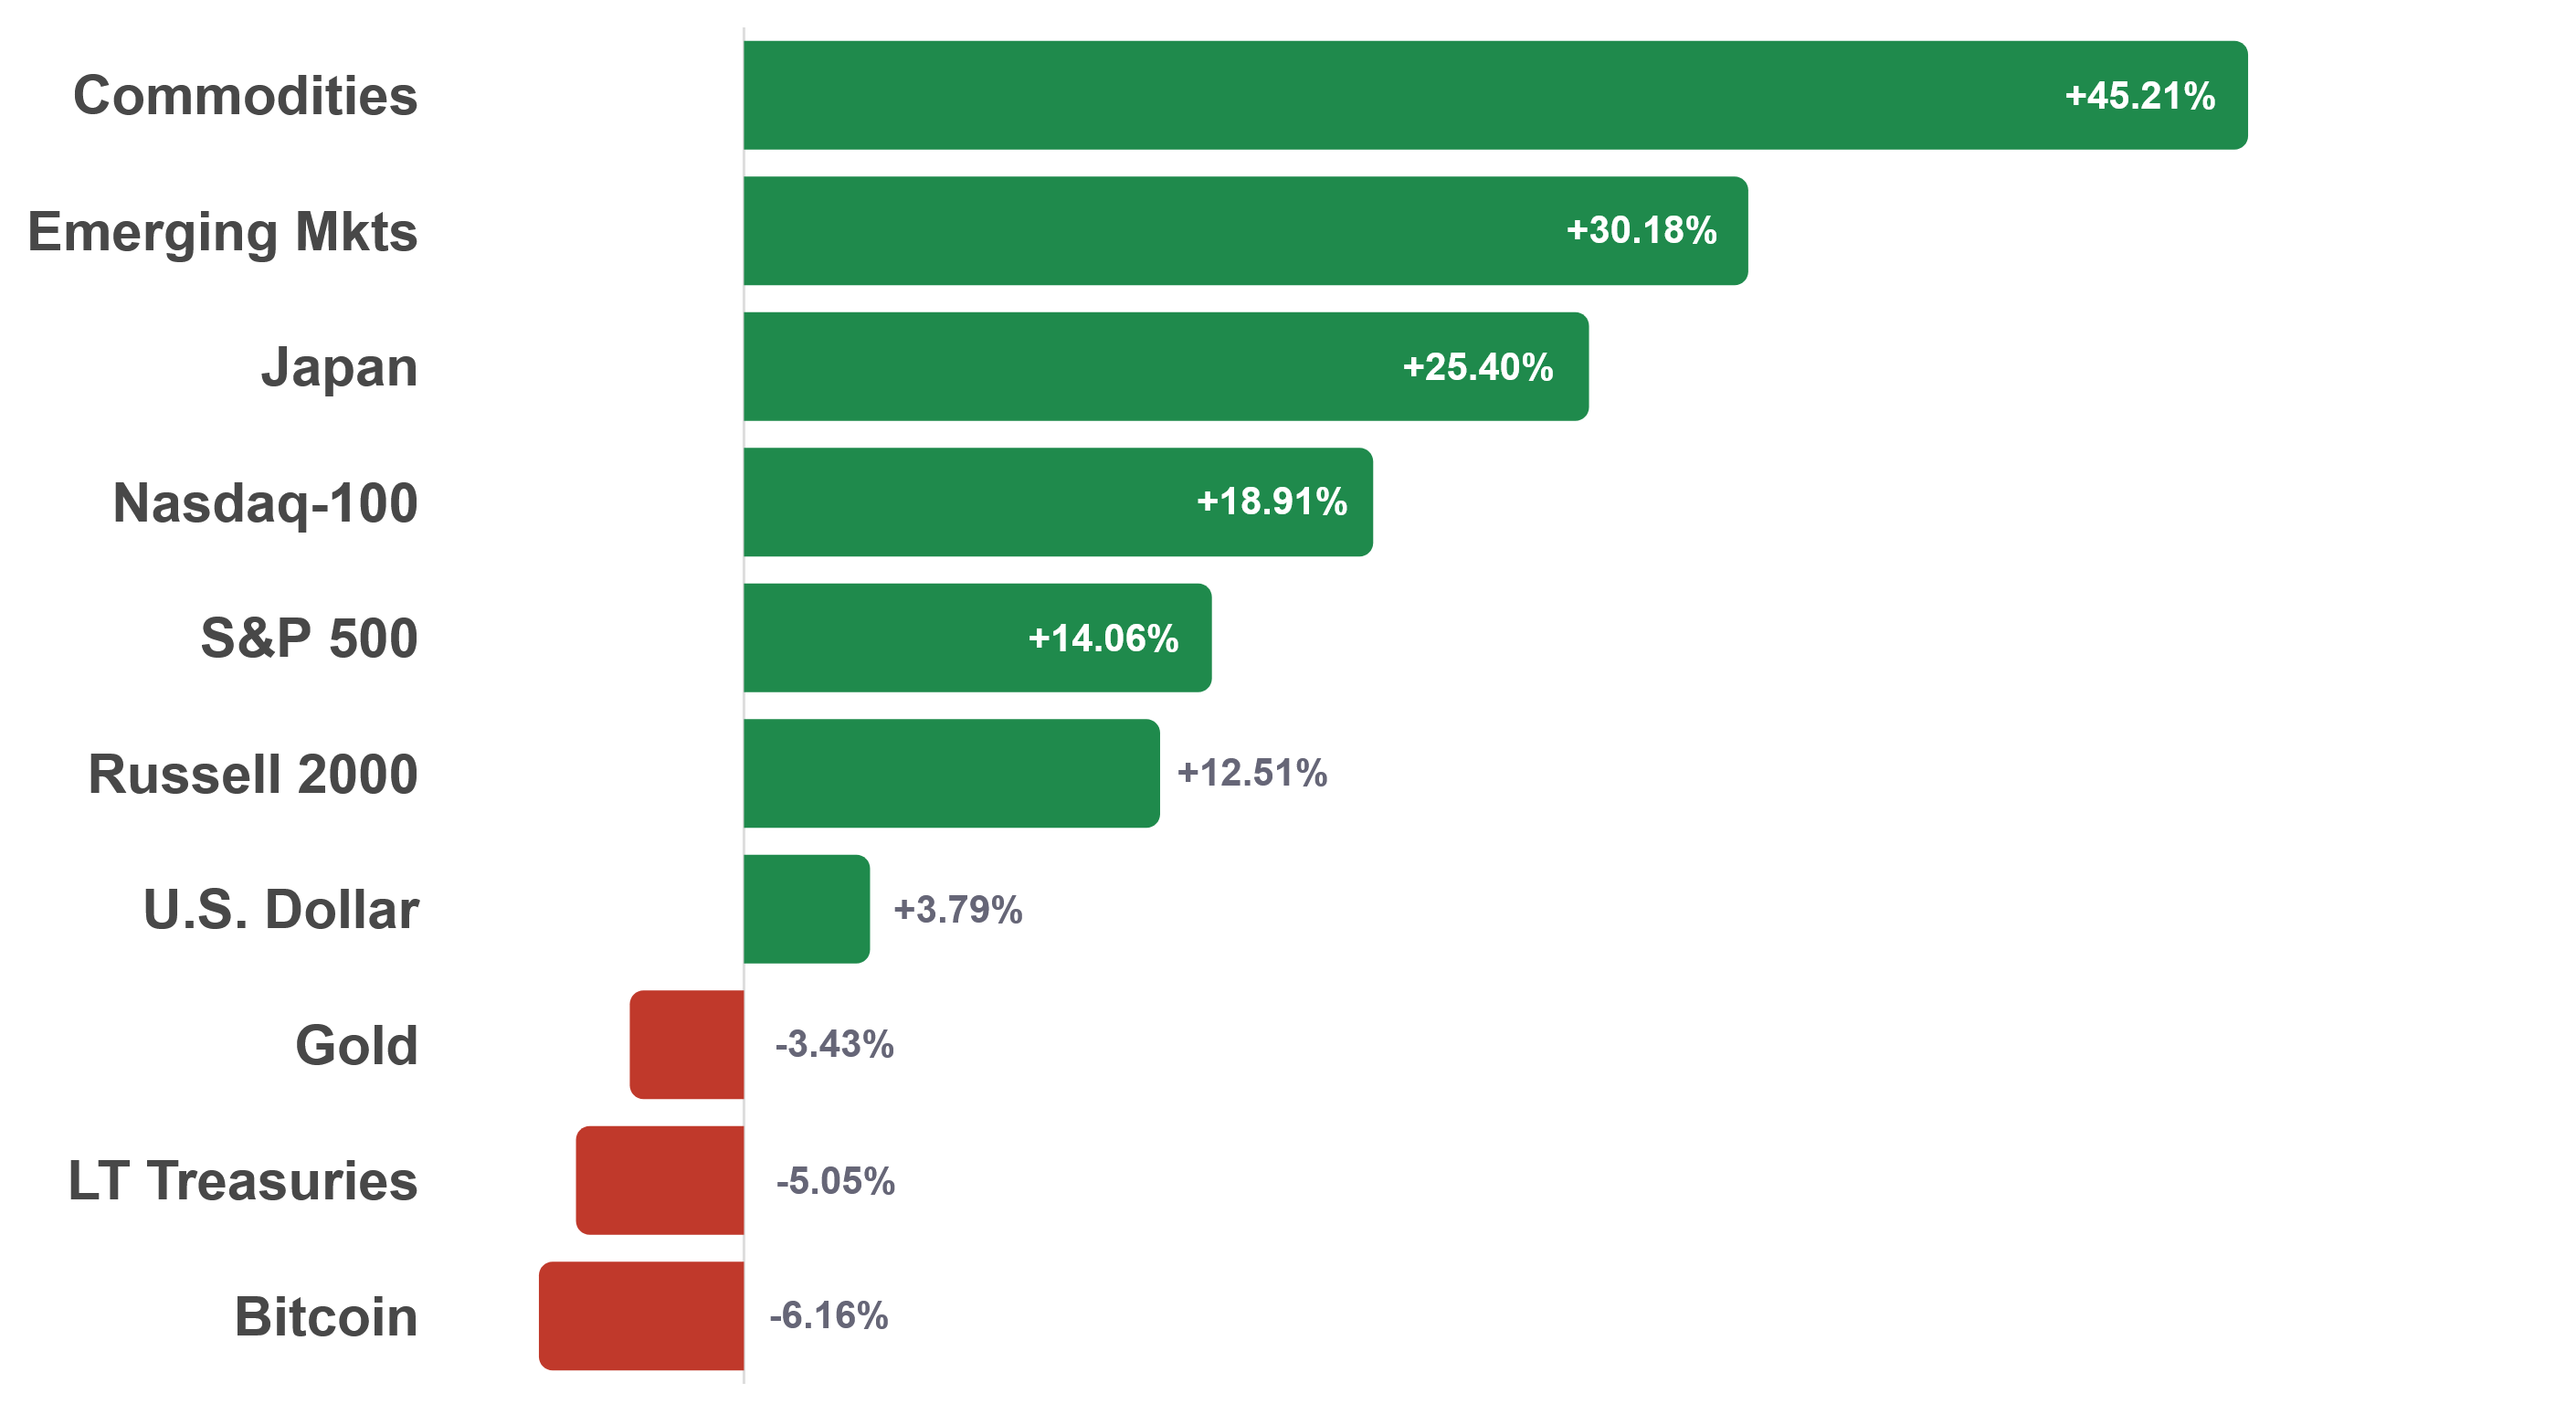
Commodities still lead the year at 45.2%, with emerging markets second at 30.2% even after October's slide. Gold, long-term Treasuries, and Bitcoin are the only assets I track that are down for the year.
Korea's Chip Rout
Korea's stock market had a brutal week. The Kospi fell 5.46% on October 13 after China's largest memory-chip maker, CXMT, said it plans to launch a server memory chip that would compete head-on with Samsung and SK hynix. SK hynix fell 10.09% and Samsung 7.39%.
On Thursday the Kospi fell as much as 8% and set off a circuit breaker, an automatic 20-minute trading halt. It closed down 7.57%, as SK hynix and Samsung fell another 11% and 9%.
My emerging markets fund (ticker EMXC, which excludes China) is about a quarter Korea and more than a third Taiwan. It's down 5.07% for October through Thursday, against 14.5% for a Korea-only fund.
Why the Nasdaq-100 Trailed the S&P 500
The Nasdaq-100 is down 1.59% this month while the S&P 500 is up 1.20%, as worries about AI weighed on tech. The OpenAI revenue report on October 8 was the first hit. The second came on October 14, when worries about the debt behind AI data centers sent CoreWeave, a cloud computing company, down more than 15% and pulled other tech stocks down with it.
What Carried October
Active commodities (ticker HGER) is the only position up this month at 2.21%. Rising oil prices helped, with Brent crude settling at $106.06 on Wednesday. Ship-tracking firm Kpler counted 10 tankers struck in the Strait of Hormuz in the week to October 4, the most in any week of the war. Iranian officials told Reuters they plan to intensify the attacks, and a deadly strike on Riyadh's airport added to the supply fears.
Precious metals pulled the other way. Silver fell about 6% on Wednesday alone and is still more than 50% below its January high, and gold is about 25% below its record.
Inflation, Jobs, and the Fed
September's consumer price index (CPI), the government's main inflation gauge, rose 0.6% for the month and 3.7% from a year earlier, up from 3.4% in August. Gasoline drove more than half the monthly gain, but core prices, which leave out food and energy, also exceeded estimates at 0.3% for the month.
Hiring went the other way. Employers added just 29,000 jobs in September against roughly 84,000 expected, and unemployment rose to 4.2%. Average hourly pay grew 3.0% from a year earlier, slower than inflation.
That mix of slower growth and faster inflation is the drift toward stagflation I flagged in September's deep dive, and it puts the Fed in a bind. After the inflation report, futures traders roughly doubled the odds of another rate hike at the October 28 meeting, from about 20% to nearly 40%, according to Kitco.

Portfolio Allocations
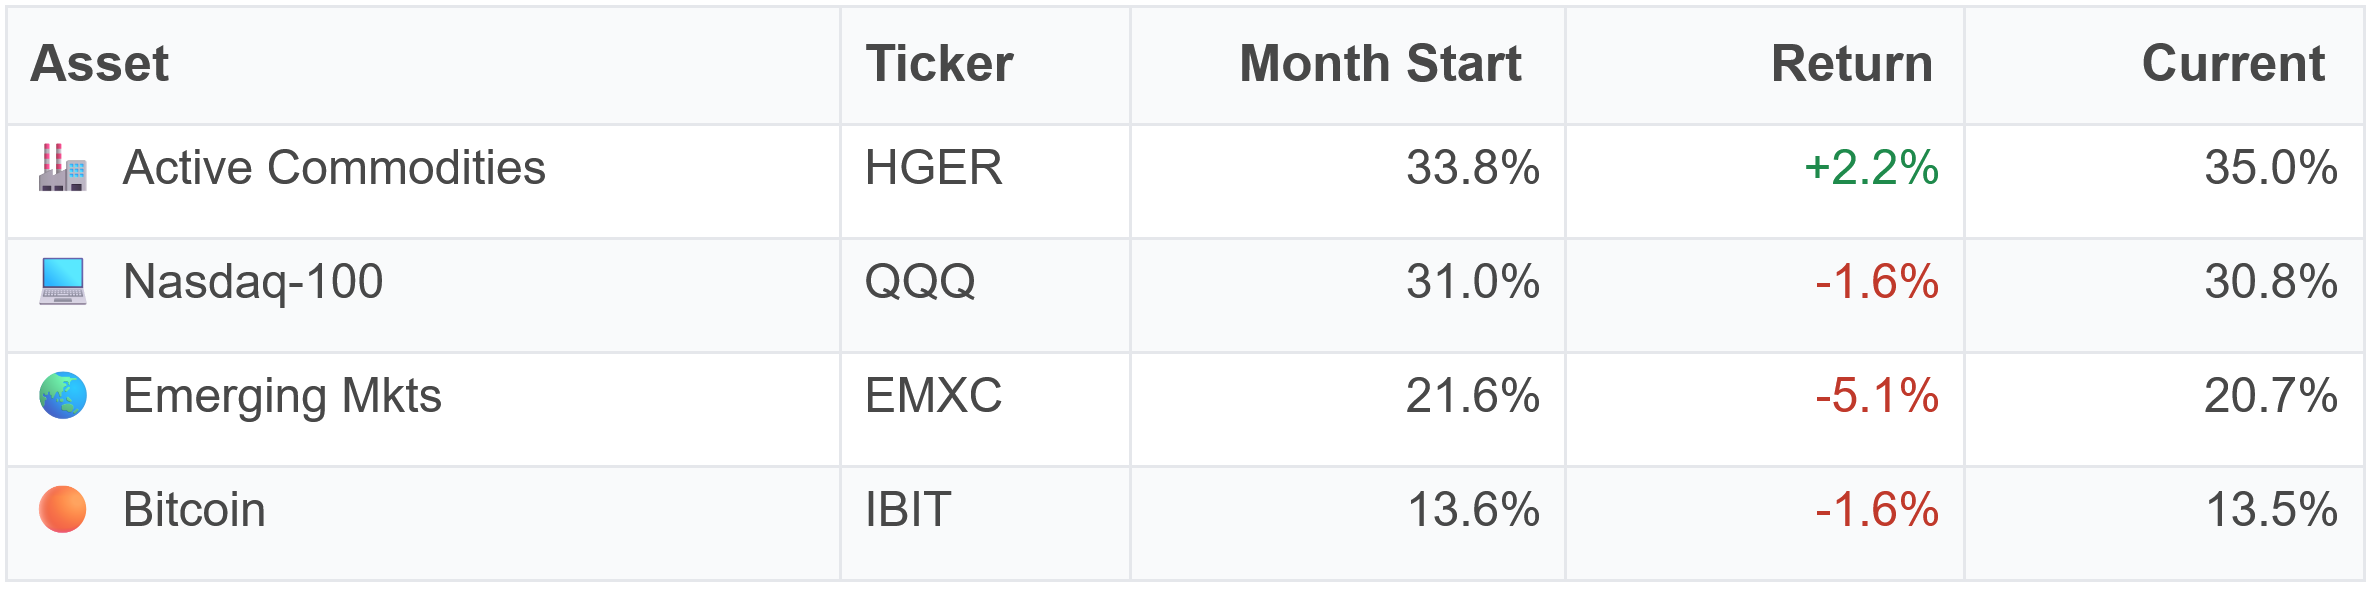
Commodities have grown to about 35% of the portfolio while emerging markets have shrunk to about 21%.
The September 30 swap hasn't paid off yet. Japan, which left the portfolio, is down 0.59% this month. The Nasdaq-100 that replaced it is down 1.59%, which cost the whole portfolio about 0.3 percentage points. Two weeks is far too brief to judge a strategy move, and the Nasdaq-100 got the slot for the usual reason: it had better momentum.
If I were picking from headlines, holding about a third of my portfolio in AI-linked companies during an AI scare would feel like the wrong call. But the rankings set these positions, and they'll reset them on October 30.

Deep Dive: If the AI Bubble Bursts, This Is How My Strategy Would Adapt
Every few days this month I've read another headline calling AI a bubble. I'll admit it gets to me a little. Two of my four positions fell with the AI trade in October, and that unease is exactly why I wrote my rules down when I was calm.
So instead of guessing whether this is the top, I want to answer two questions. How much of my portfolio actually rides on AI? And if the selloff deepens, how much could it cost before my strategy responds?
How much of my portfolio rides on AI
More than the fund names suggest. Nasdaq estimates that at least 70% of the Nasdaq-100 (QQQ) sits in AI-themed companies. About half of my emerging markets fund (EMXC) is technology, and three chipmakers (TSMC, Samsung, and SK hynix) make up roughly 36% of it. Counting all of that technology as AI-linked, which is a rough shortcut, about a third of my portfolio is in AI-linked companies.
Bitcoin is a separate risk. It isn't an AI company, but this year, on the 40 days the Nasdaq-100 fell 1% or more, Bitcoin fell on 34 of them. Active commodities, about a third of the portfolio, was roughly flat on those days on average, and it's the one position that carried October.
That much AI exposure isn’t unusual right now. The 10 largest companies make up roughly 38% of the S&P 500, compared with about 27% at the peak of the dot-com bubble. So a plain index fund carries a big AI bet too. The difference is how—and if—a strategy can respond, should this bet go wrong.
How the strategy adapts
At the end of every month, my strategy goes through the same five steps.
- Start with the same ten ETFs every month. I chose them to cover four broad economic environments, the combinations of rising or falling growth with rising or falling inflation. Four are stock funds (the Nasdaq-100, the Russell 2000, Japan, and emerging markets). The other six are active commodities, Bitcoin, gold, long-term Treasuries, defensive equity, and T-bills. I rarely add or remove a fund.
- Screen the stock funds. The four stock funds are ranked on short-term momentum, meaning how much each has gained recently, and the weakest one sits out that month.
- Rank the other nine. The remaining nine ETFs are ranked on their momentum over a longer stretch, and the top four make the portfolio.
- Size each position by its volatility. Each weight depends on how much that ETF's daily returns have swung over the past 12 months, and ETFs that are less erratic get bigger weights. As a simplified example of how risk parity sizing works: an ETF that fluctuates half as much as another gets twice the weight.
- Trade once a month. The rankings use closing prices from the month's next-to-last trading day, and the trades happen at the close on the last one.
The 10 ETFs my strategy tracks and ranks
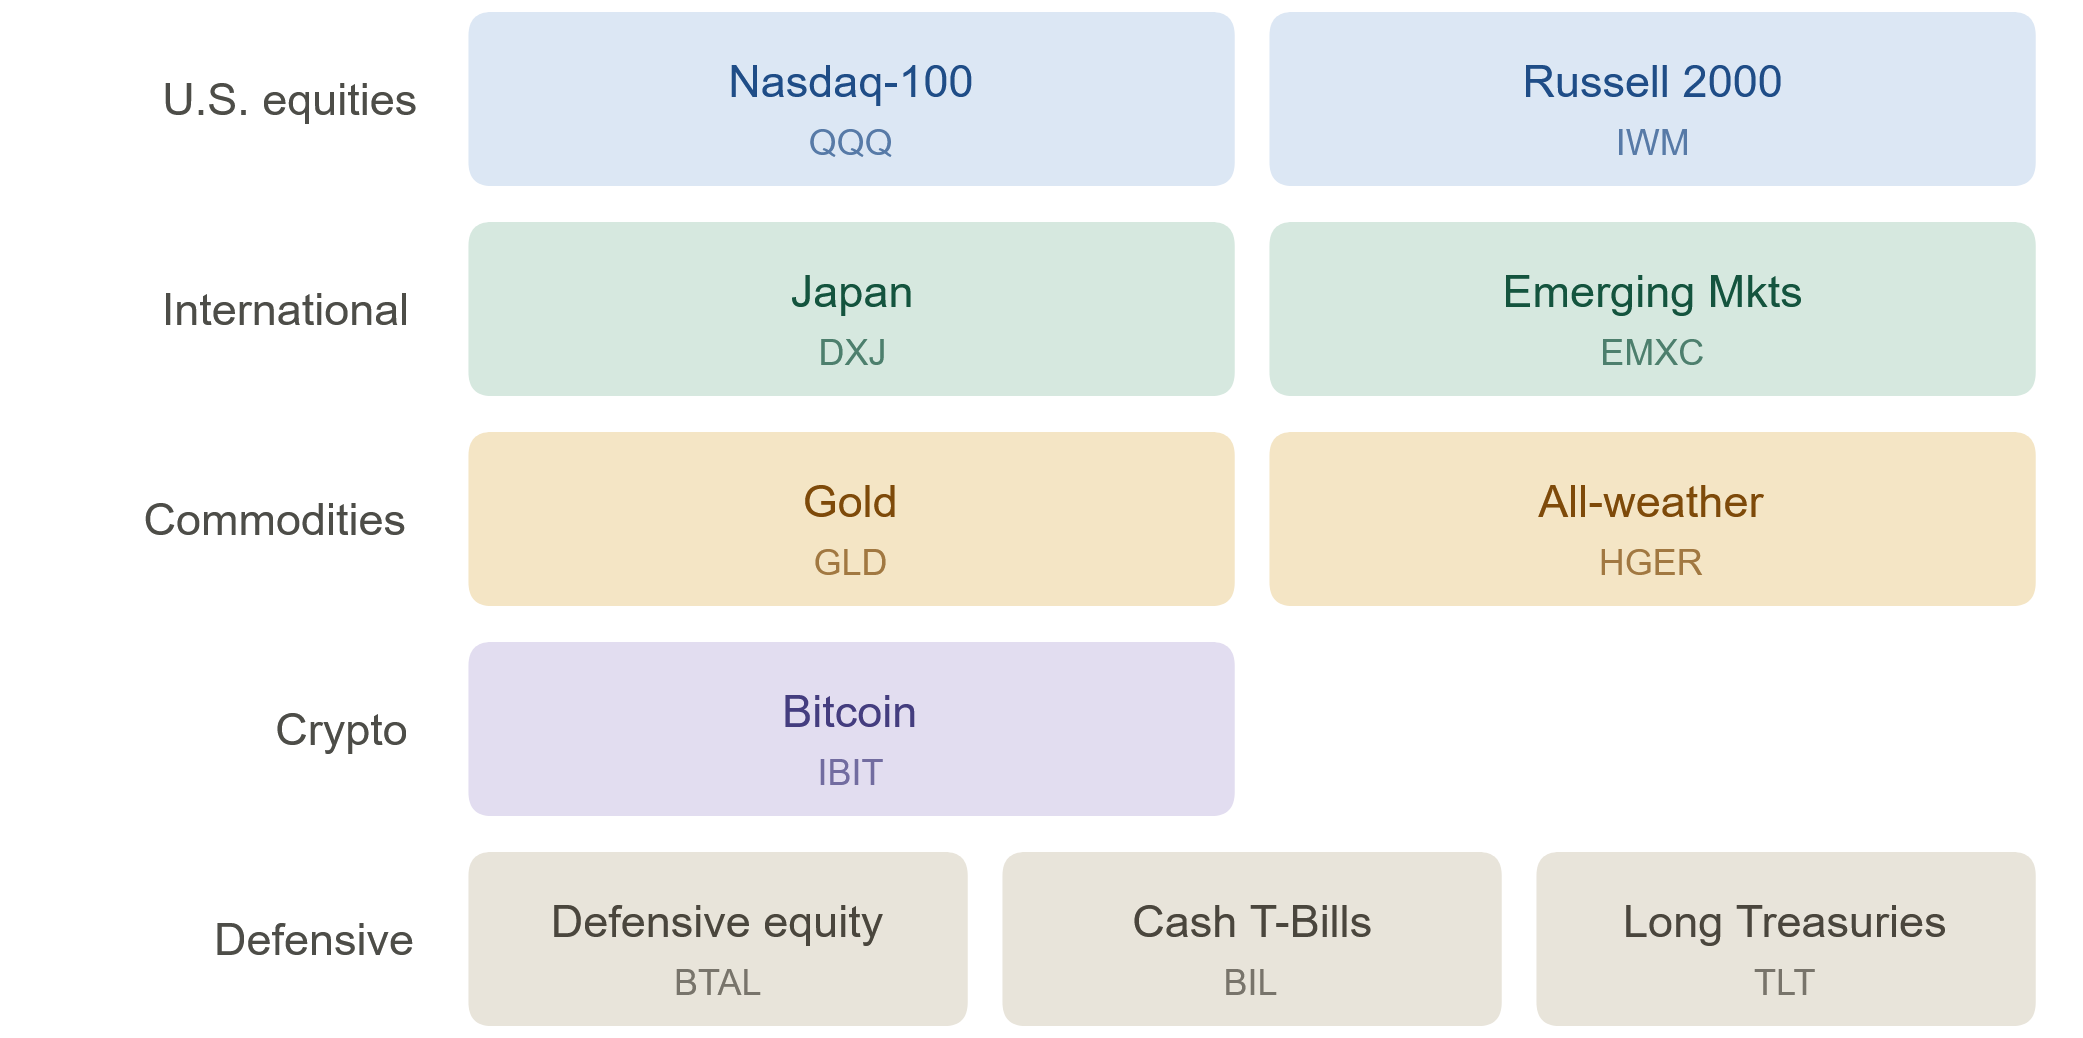
The lookback periods in steps 2 and 3 are the part I keep private. My live strategy blends more than one lookback period in each ranking, and I adjust them over time as markets change, after extensive backtesting.
The backtest in this issue uses a simplified public version instead, with a two-month lookback for the stock screen and a six-month lookback for the main ranking. Over the full backtest, it returns less than my current settings, and it won't match my live portfolio month to month.
An off-ramp to cash
T-bills (ticker BIL, short-term government debt that works like cash) are the off-ramp. They compete in the same ranking every month. When stocks and Bitcoin stop rising, the T-bills' small, steady gain can climb past them.
Momentum funds that only hold stocks don't have that option. In a bear market, the best they can do is pick the stocks falling the least. A 60/40 portfolio has the same problem in a year like 2022, when stocks and bonds fell together.
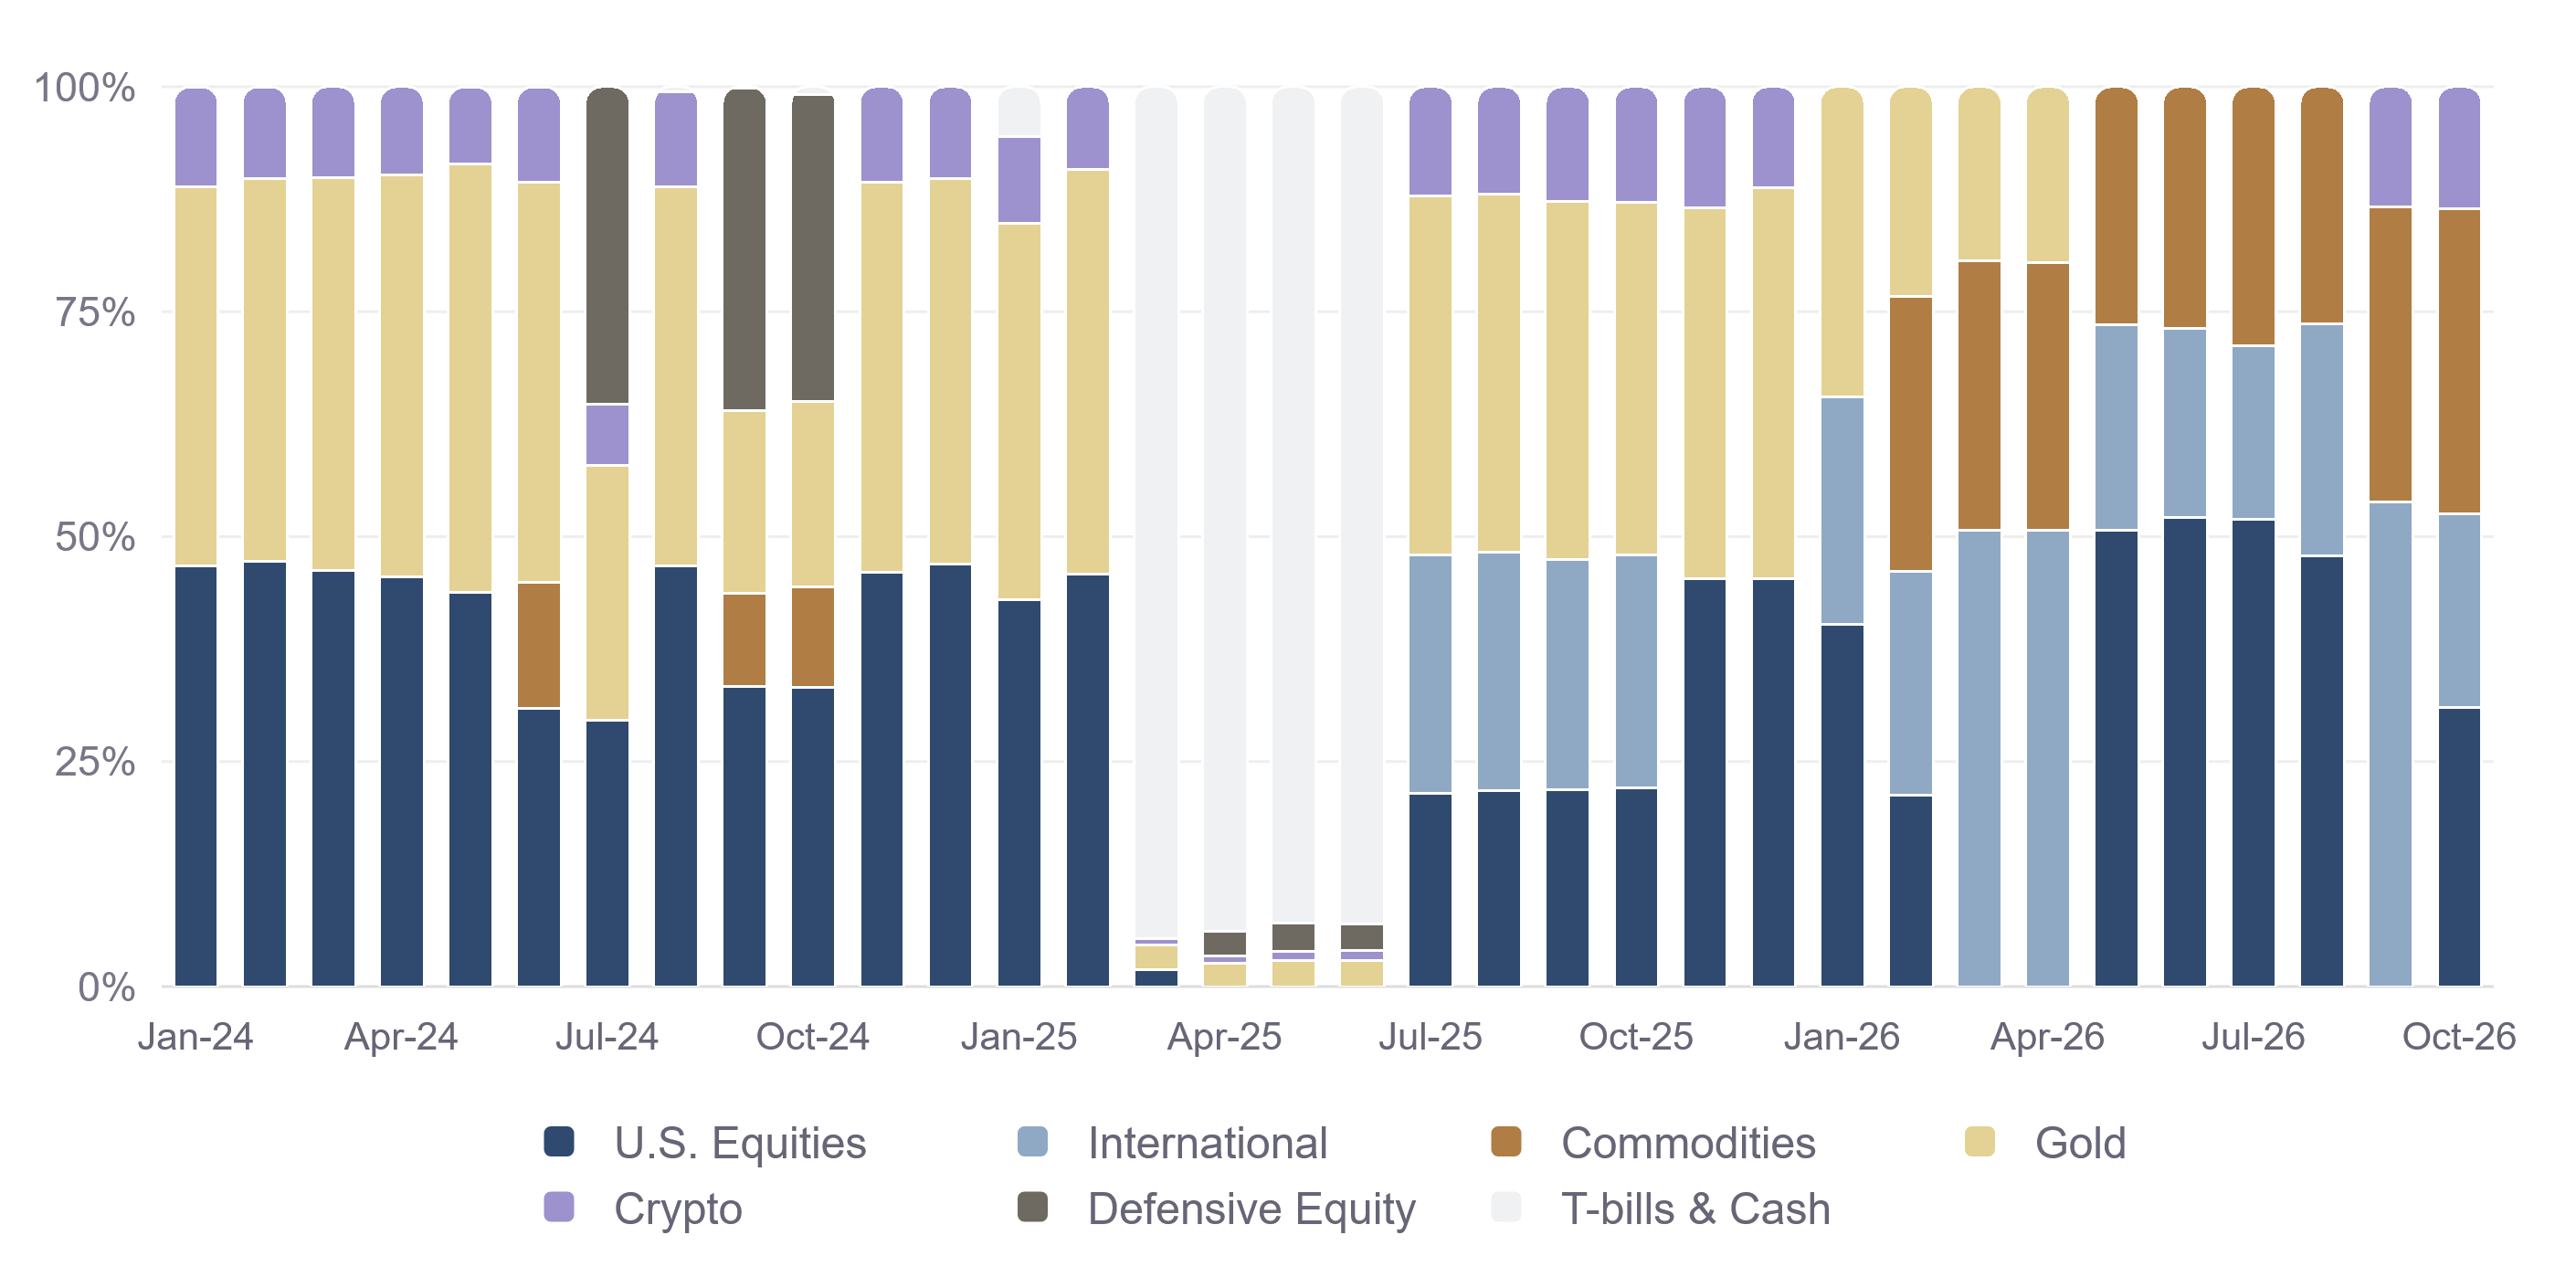
Because T-bills barely move (low volatility), step 4 hands them most of the portfolio (risk parity weighting) once they make the top four, usually taking up about 95% of the portfolio. So T-bills entering is close to a full exit, though a market selloff doesn't guarantee they'll make the cut. My own account made that exit in 2025, when T-bills held more than 90% of the portfolio from March through May.
The three other defensive funds in my ETF basket are:
- 🟨 Gold (GLD) tends to hold up when investors lose confidence in stocks or currencies.
- 🏦 Long-term Treasuries (TLT) tend to rise when fear of a slowdown pushes interest rates down.
- 🛡️ Defensive equity (BTAL) buys stocks that move less than the market and bets against those that move more.
When T-bills aren't in the top four crowding out the others, each of these defensive funds typically gets about 25% to 35% of the portfolio. They can cushion a decline, but they can fall too.
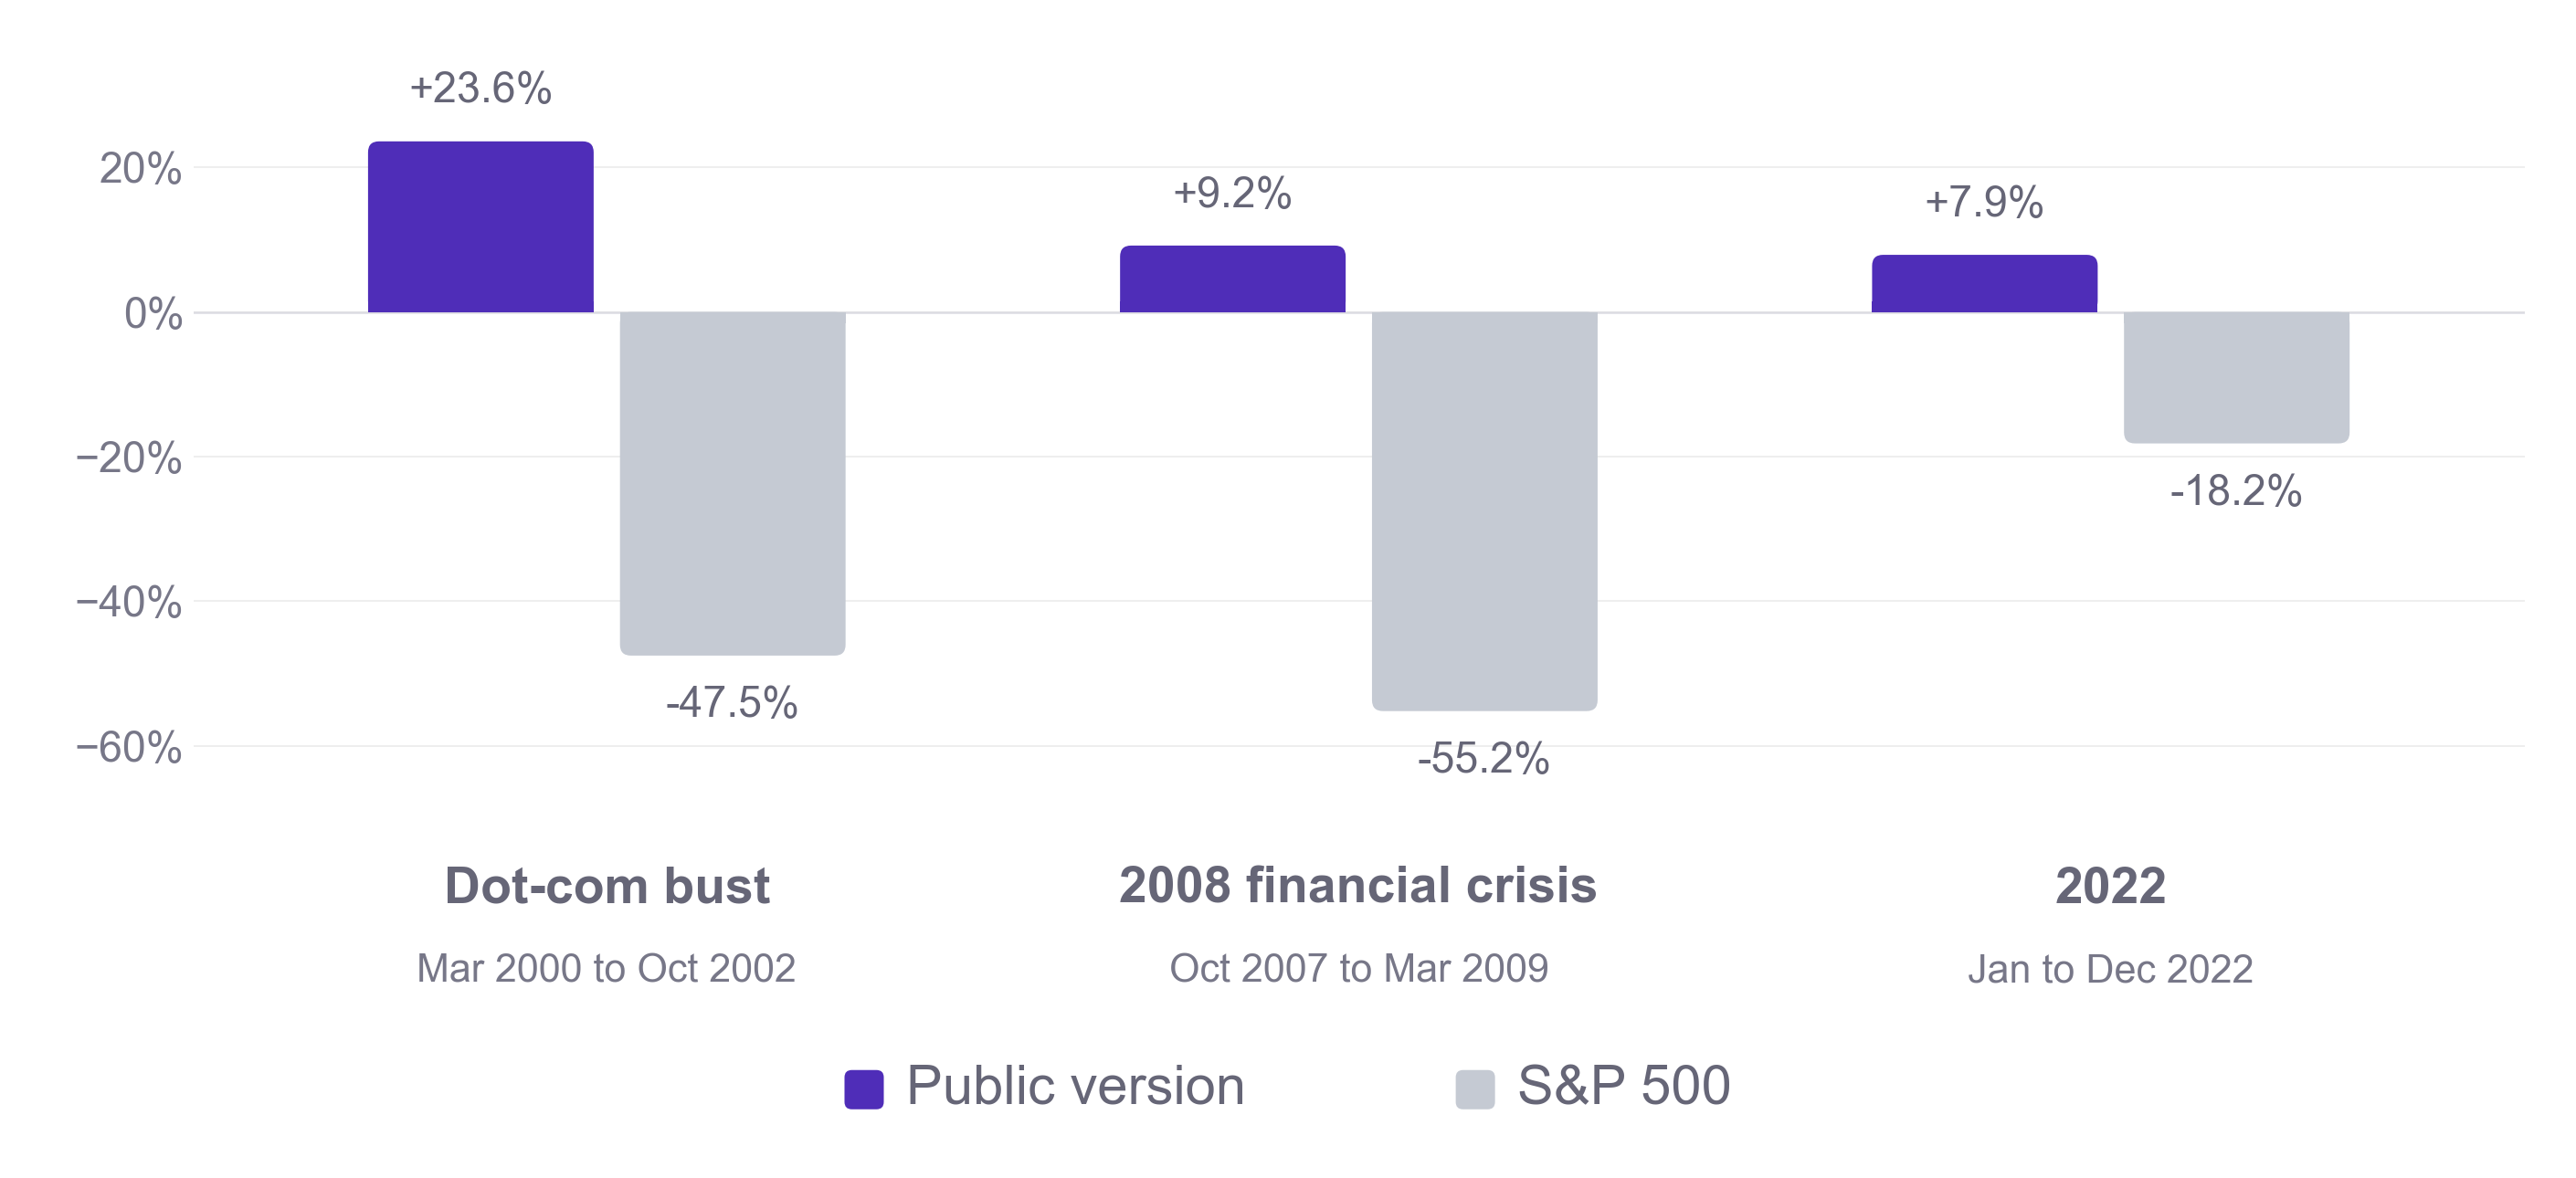
In the backtest, the strategy held mostly T-bills, Treasuries, commodities, defensive equity, and gold through the dot-com bust and the 2008 financial crisis. From the S&P 500's peak to its low each time, it gained about 24% and 9% while the S&P 500 lost 48% and 55%. In 2022, it gained about 8% while a 60/40 portfolio lost about 16%.
The chart below shows every month since my actual strategy went live. The nearly solid T-bill bars (light grey) are the spring 2025 exit.
Three ways this could play out
I can't say exactly where the line sits, because that depends on how all ten ETFs move before the October 30 rebalance. But the rankings point to three broad paths.
🧯 The chip scare stays contained. If the damage stays mostly in Korean and Taiwanese chipmakers, the most likely change is small. When I ran my live ranking on Thursday's closing prices as a rough check, emerging markets had slipped to fifth, behind Japan and just ahead of T-bills. A swap like that would leave the portfolio mostly invested.
💥 Tech breaks. If the Nasdaq-100 and Bitcoin fall hard over the next two weeks, the defensive assets closest to the top four are T-bills and defensive equity. Defensive equity has been rising as tech falls.
If T-bills enter the top four, most of the portfolio would move to them at the October 30 rebalance. If only defensive equity does, it would take a smaller slice.
💧 A slow leak. If prices grind lower over months instead, the strategy would likely step down one position at a time. This is the path where whipsaw lives, when it sells, buys back in, and gets caught again. The August 2015 example below shows what that can cost.
How much damage before the defense steps in
This is the part I care about most, because the strategy only trades once a month. Whatever happens between now and October 30 hits the portfolio I already hold.
Since going live in January 2024, the strategy's worst two-week stretch was a 6.4% drop in mid-2024, and its worst month was a 3.6% loss in March 2026. That record hasn't faced a real bear market, so I also ran a backtest of the public version over data back to 1995. It's a reconstruction, not my live account, and Bitcoin only enters my strategy's basket of available investments in 2015, once there's enough price history to rank it.
The backtest entered 123 of 376 months with at least half the portfolio in stocks and Bitcoin, as mine is now. Here's what those months show.
- Most sharp drops didn't end in a switch to defense. In 10 of those months, the portfolio fell more than 5% over two weeks. Only four were followed by a switch to defense at the next rebalance. In the other six, the next month's portfolio wasn't mostly defensive, and in four of them the portfolio had recovered some ground by month-end.
- At the four rebalances that did switch, the portfolio was down about 5% to 12% from its high. The worst point sometimes came earlier. In August 2015 it was down about 15% before bouncing. In the 30 trading days after each switch, losses from that same high grew by at most about 1.3 percentage points.
- Across all 23 switches to defense, the median loss from the high was about 2%. Five were worse than 5%, and the worst was about 12%, in May 2012.
- From the middle of a month to its end, the worst loss was about 6.5%. That was in August 2015, and we're at that midpoint now.
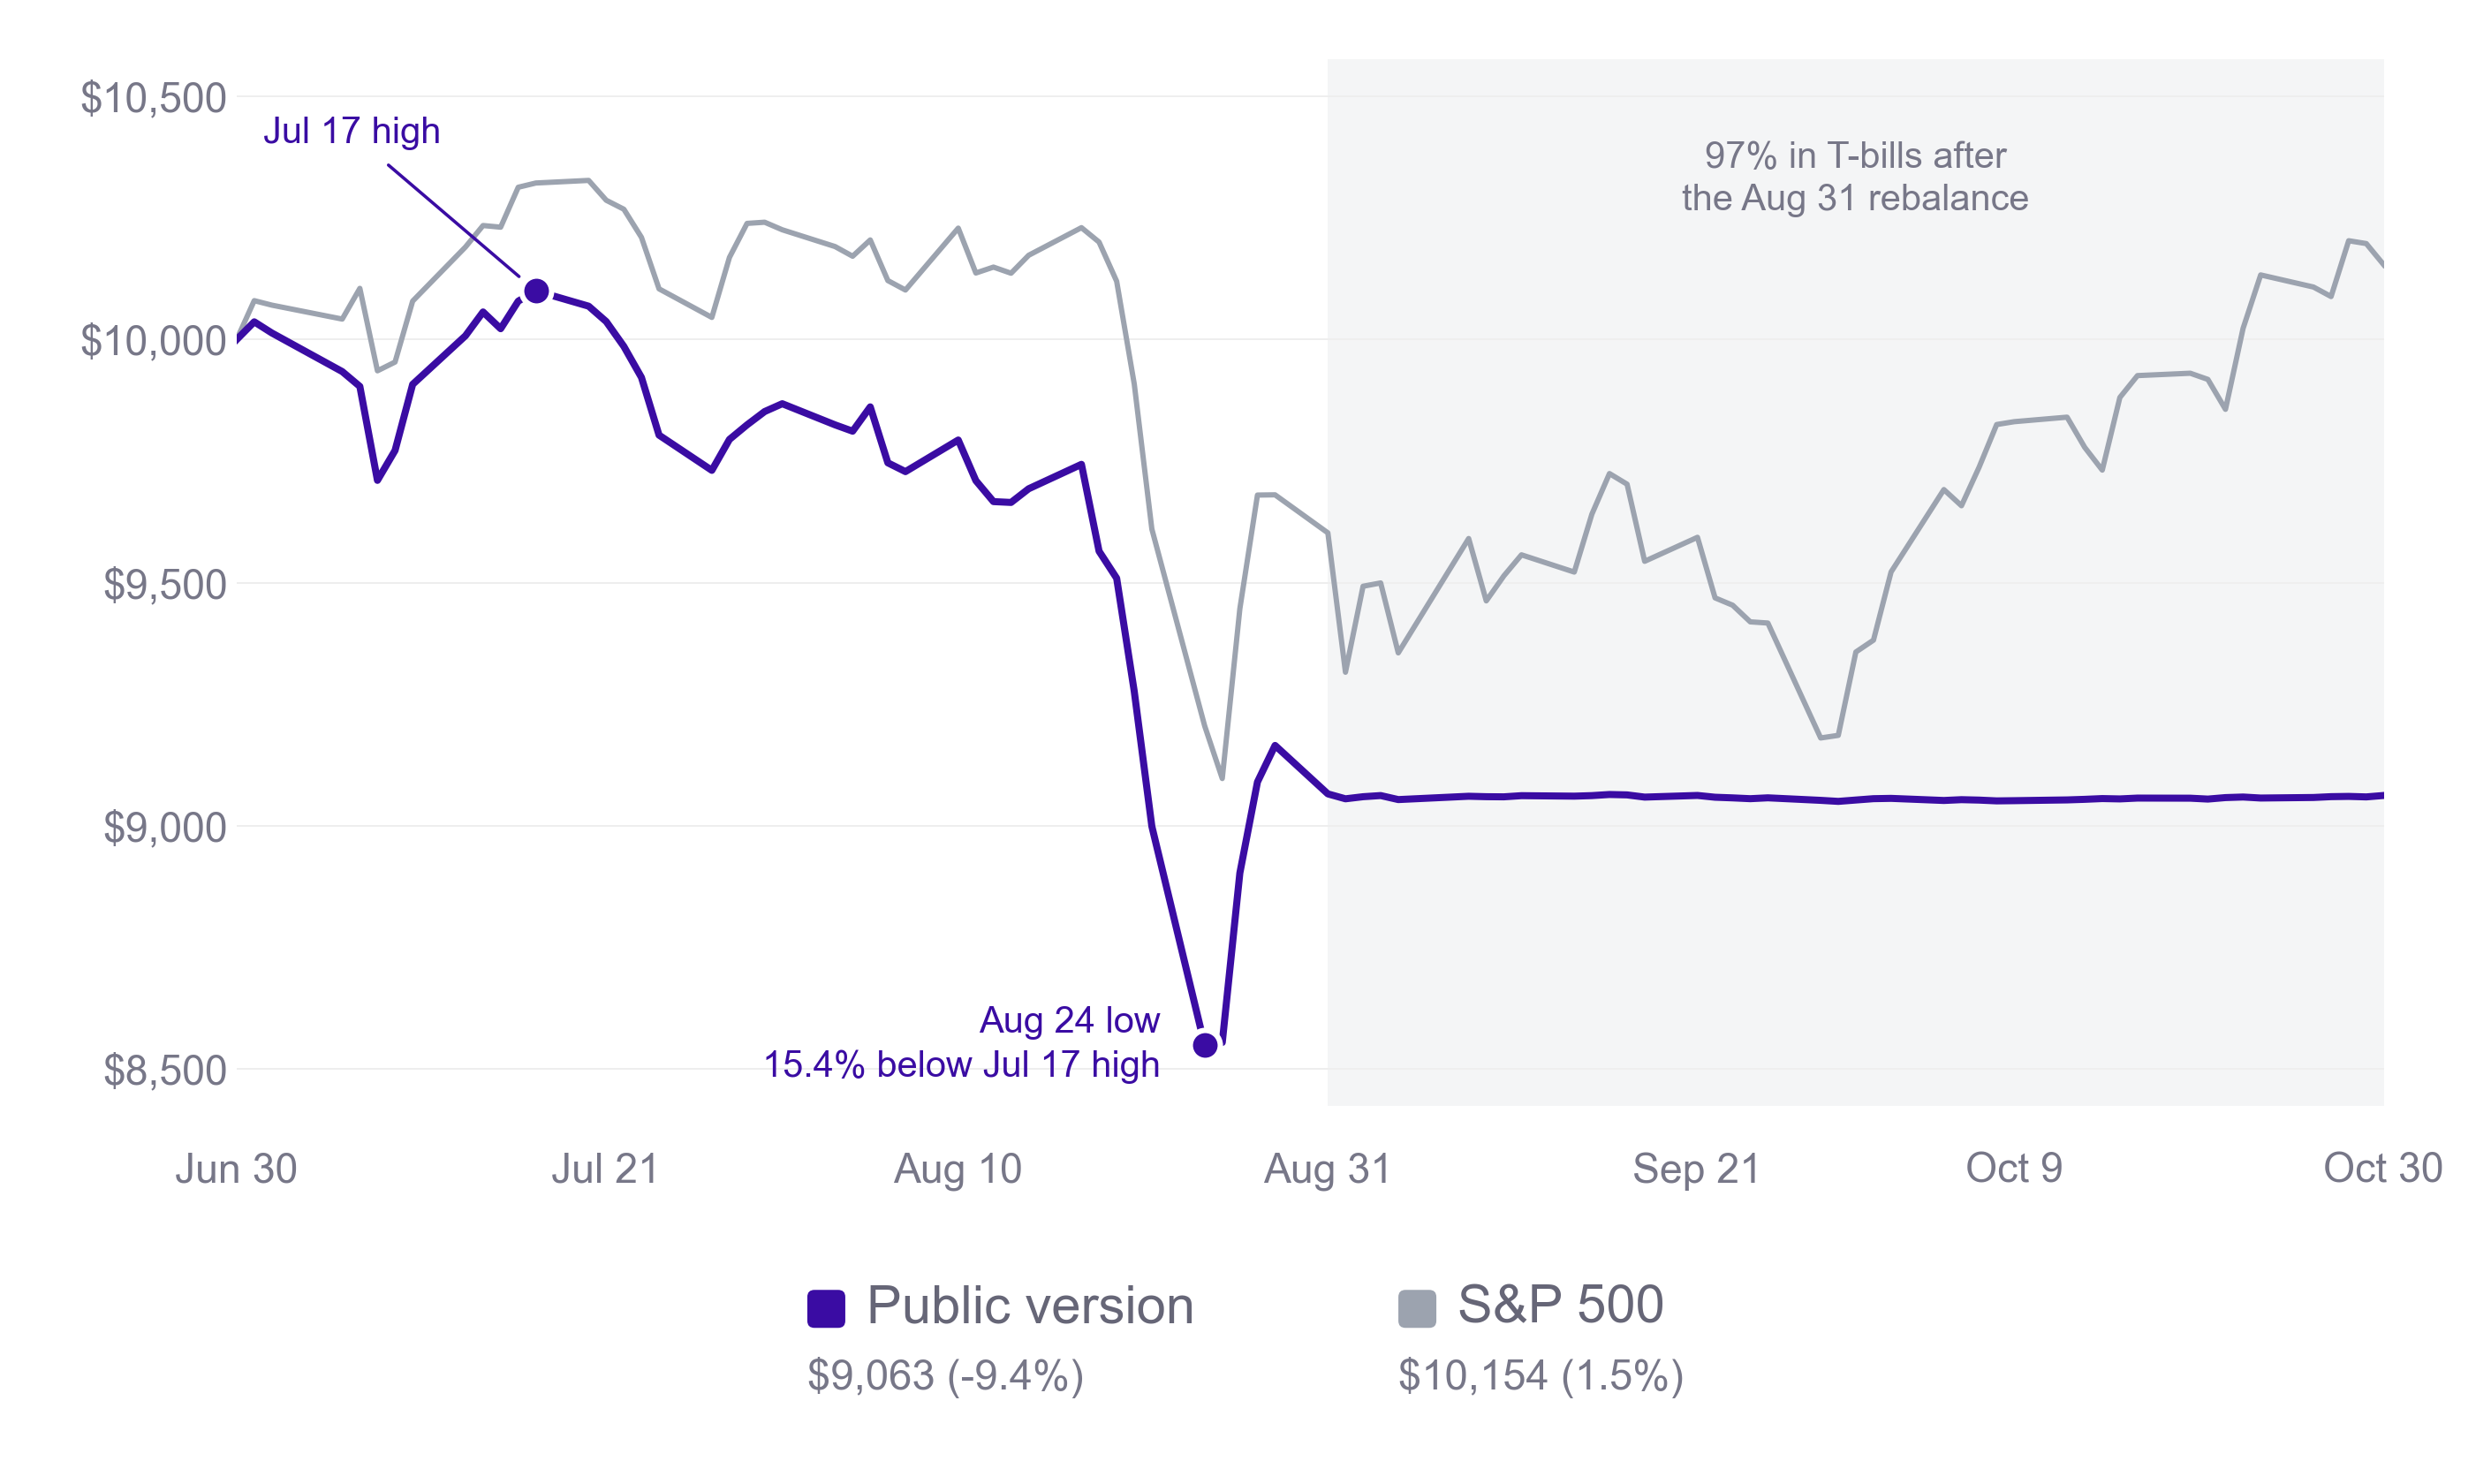
August 2015 is the closest thing in the backtest to a sudden break while fully invested. The strategy went into August with everything in stocks and Bitcoin. When China devalued its currency, it fell about 15% from its July 17 high to its August 24 low, against 11% for the S&P 500. It bounced to finish the month about 10% below that high, and the August 31 rebalance moved 97% of the portfolio into T-bills.
That exit came near the bottom. The S&P 500 gained 8.5% in October while the portfolio sat in T-bills. That's the whipsaw cost, and it's the kind of market where a momentum-based strategy like mine can struggle.
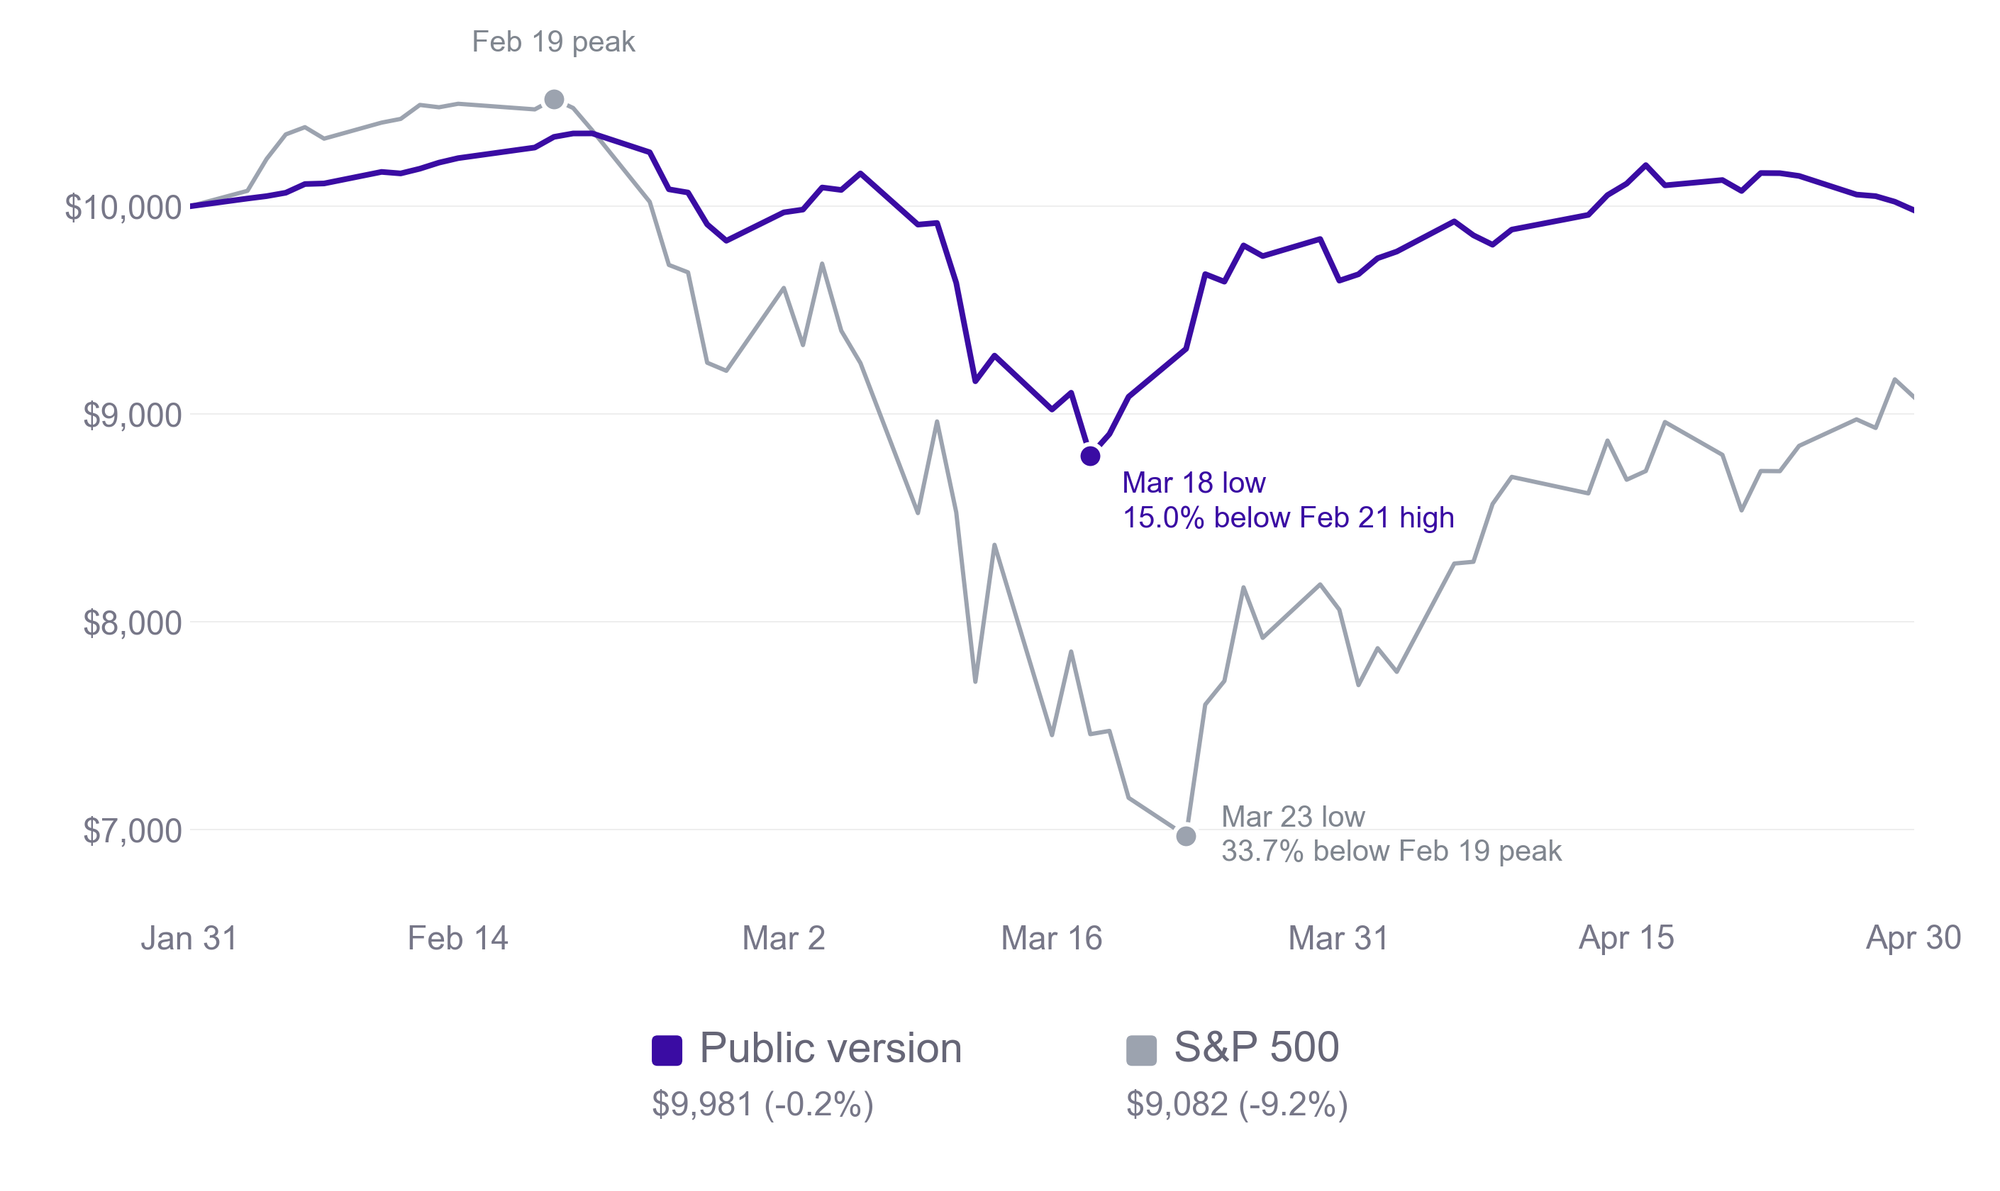
COVID went differently. The strategy went into February 2020 with more than half its portfolio in gold and Treasuries. It had already begun to position more defensively and kept about the same mix through March. It lost about 10% from February 19 to March 23, while the S&P 500 lost 34%. Gold and Treasuries sold off too in mid-March, and at its March 18 low the portfolio was about 15% below its February high.
The backtest's deepest drop from a high was about 20%, in May and June 2006. Emerging markets, Japan, gold, and commodities fell together, while the S&P 500 fell less than 8%.
The backtest includes only about 11 years of Bitcoin, and if a crash starts right after a rebalance, the strategy would wait a full month to respond.
The first leg of a decline is a cost I accept in exchange for never having to call the top.
What I'm doing about it
Nothing different. My relative strength momentum strategy doesn't care if this is a bubble. It is ready to play defense if and when its risk-off assets gain momentum and take the lead, pushing out my current, largely risk-on positioning.
If the AI trade keeps breaking, the rankings would likely start to show it, and the portfolio could turn more defensive at a coming rebalance. That isn't guaranteed. In the backtest, most sharp drops didn't trigger a switch right away. That’s by design, since many selloffs bounce back and selling into every one would lock in losses.
This isn't a forecast. I don't know whether AI stocks have peaked, and my plan doesn't depend on me knowing.
The most important part of every plan is planning on your plan not going according to plan. - Morgan Housel
That line, from The Psychology of Money, sums up this deep dive. My strategy already spells out what happens if my current positions stop working, so I don't need to predict if this recent decline turns into something worse.
Wrap Up
Headlines calling AI a bubble, and a market in Korea halting trading mid-session, make it tempting to sell first and think later. That's the impulse my strategy exists to override. At the October 30 rebalance, the rankings will either keep the portfolio invested or move it toward defense. Either way, I won't be the one making that call in the middle of a scary week.
I'll be back at the end of the month with the November update. Thanks for reading.

Methodology and Backtest Notes
The public version. My live strategy follows the five steps in the deep dive, but it blends more than one lookback period in each ranking, and I keep those settings private and adjust them over time. Every backtest figure in this issue uses a simplified public version, with a two-month lookback for the stock screen and a six-month lookback for the main ranking. Backtests in earlier issues used my live lookbacks. Backtest drawdowns I quoted in 2025, such as about 6%, used month-end values, which miss drops that recover within a month, so the daily figures in this issue run deeper.
How I chose it. I compared about 40 lookback combinations and picked this one after the fact, because it's simple and behaves much like my current settings in the major selloffs, including COVID, while returning less over the full backtest. That makes it a stand-in, not a conservative bound on future losses. It also didn't make the spring 2025 move to T-bills that my live account made.
How the backtest works. Every backtest figure in the deep dive is hypothetical, including the months that overlap my live account since January 2, 2024. The backtest runs from June 1995 through September 2026, with signals from the close of each month's next-to-last trading day and trades at the close of its last trading day. Momentum compares each fund's price on the signal date, with dividends reinvested, against its month-end price two or six months earlier.
Volatility is the standard deviation of daily returns over the prior 12 months, on days all the selected funds traded, and the weights don't account for how the funds move together. Bitcoin enters the ranking in April 2015, once there's enough price history to rank it. The backtest leaves out transaction costs and taxes.
Data before each fund launched. Before IBIT launched in January 2024, its history is the price of Bitcoin itself, less the fund's 0.25% annual fee. Bitcoin's prices before 2024 are daily closes at midnight UTC, a few hours after the U.S. market close, so its trades in those years are approximate.
Other funds that launched later are extended backward with older funds or indexes, using the chains listed in the June 9, 2026 issue, except that emerging markets now uses a synthetic MSCI Emerging Markets ex China series from October 2004 to EMXC's July 2017 launch (rebuilt October 3, 2026). These stand-ins track similar exposures but aren't the same investments. Defensive equity before September 2011, for example, uses AQR's Betting Against Beta research factor, which is built differently from BTAL.
Definitions used in the deep dive. "Mostly stocks and Bitcoin" means at least half the portfolio in the four stock funds and Bitcoin combined. A "switch to defense" means the next month's portfolio is at least half T-bills, long-term Treasuries, defensive equity, or gold. A "two-week drop" is the worst return over any 10 trading days within the holding month, on the exchange trading calendar. "From the middle of a month" runs from the close of the holding month's 10th trading day to the rebalance.
The loss at a switch runs from the highest value since the stretch of mostly-stocks-and-Bitcoin months began to the rebalance where the switch happened. The typical T-bill weight is the median across backtest months that held BIL after its 2007 launch (about 95%, ranging from about 75% to 98%), and the 25% to 35% range for the other defensive assets rounds the middle half of their weights (about 27% to 34%) in months they were held without T-bills, over the same period. The live record's two-week figure uses the same 10-trading-day window, measured on the daily reconstruction of my account that ties to Fidelity's monthly returns.
Three of the four sharp-drop switches came before Bitcoin joined the backtest. The dot-com and 2008 figures run from the S&P 500's peak to its low (March 24, 2000 to October 9, 2002, and October 9, 2007 to March 9, 2009). The 2022 figures are calendar-year returns, and the 60/40 portfolio is AOR.
How sensitive the findings are. I moved one cutoff at a time. With a 40% or 60% threshold for stocks and Bitcoin, or a 40% or 60% threshold for defense, the worst loss at a switch ranges from about 10% to 13%, and the worst loss from mid-month to month-end from about 6.5% to 8%. The sharp-drop results move more.
Across drop sizes of 4% to 7%, windows of 5 to 15 trading days, and those same thresholds, the losses at switches that followed a sharp drop ranged from about 1% to 13%. That's why I treat the counts and ranges as descriptive, not as odds or limits.
The October 15 ranking check. I ran my live ranking on Yahoo Finance closing prices as if October 15 were the month's end. It's a rough check, since the real signal uses the close before the month's last trading day. The same check on September 29 prices, the signal date for the September 30 rebalance, reproduces the actual October lineup.
Sources for the AI look-through. Bitcoin's and active commodities' down-day figures use Yahoo Finance adjusted closes from January 2 to October 15, 2026. Nasdaq's AI-thematic estimate is as of June 30, 2026. EMXC's sector, country, and holdings weights are from iShares and Morningstar, late September and early October 2026. S&P 500 concentration is 37.8% as of August 31, 2026, per Manning & Napier, against 27% at the 2000 peak, per Goldman Sachs.
Backtested and backfilled results are hypothetical. They do not reflect actual trading, they were built with the benefit of hindsight, and they carry the inherent limitations of any simulation. Past performance does not guarantee future results.
Disclaimer & Disclosure
This newsletter is for informational purposes only and does not constitute financial advice, investment recommendations, or an offer to sell or buy any securities. The content is published as a journal of the author's personal investment activities and is intended for a general audience.
No Investment Advice: The author is not a financial advisor. You should not treat any opinion expressed herein as a specific inducement to make a particular investment or follow a particular strategy, but only as an expression of opinion.
Risk Warning: Investment involves risk, including the possible loss of principal. Past performance is not indicative of future results. No investment strategy or risk management technique can guarantee returns or eliminate risk in any market environment.
Data & Accuracy: Information contained herein has been obtained from sources believed to be reliable, but its accuracy and completeness are not guaranteed. All expressions of opinion are subject to change without notice in reaction to shifting market conditions.
Positions: The author currently holds positions in the securities mentioned in this newsletter. The author may buy or sell these securities at any time without notice.
Copyright: This content is provided solely for the personal use of the subscriber. Any unauthorized copying, forwarding, or distribution of this material is prohibited without prior written consent.