

My November portfolio allocations are in the paid second half of this update. October was my strategy's worst month since March, with emerging markets and the Nasdaq-100 doing most of the damage. Broad commodities was the lone bright spot. Below is a quick look at what happened, plus a note on Thursday night's tech selloff.
📌 This newsletter explains how I invest my own money, using a simple portfolio of four ETFs. The aim is to match or exceed the returns of a traditional balanced portfolio, but with shallower drawdowns. I share what I hold and why, so you can watch it play out.
MTD: Asymmetric Edge −2.31% vs. 80/20 (AOA) +0.52%, S&P 500 +0.88%
YTD: Asymmetric Edge +24.34% vs. 80/20 (AOA) +10.28%, S&P 500 +13.70%
YTD outperformance: +14.1% vs. 80/20, +10.6% vs. S&P 500
Quick Take
October was a down month for my strategy, even as the S&P 500 and the 80/20 benchmark gained. My portfolio fell 2.31% through October 29th. The 80/20 stock-and-bond benchmark gained 0.52%, and the S&P 500 rose 0.88%. My strategy holds only four funds, so when three of them decline in the same month, the whole portfolio feels it.
Year-to-date, $10,000 invested in the strategy on January 1st would be worth about $12,434 as of October 29th. The same $10,000 in the 80/20 benchmark would be worth about $11,028.
Where October's Loss Came From
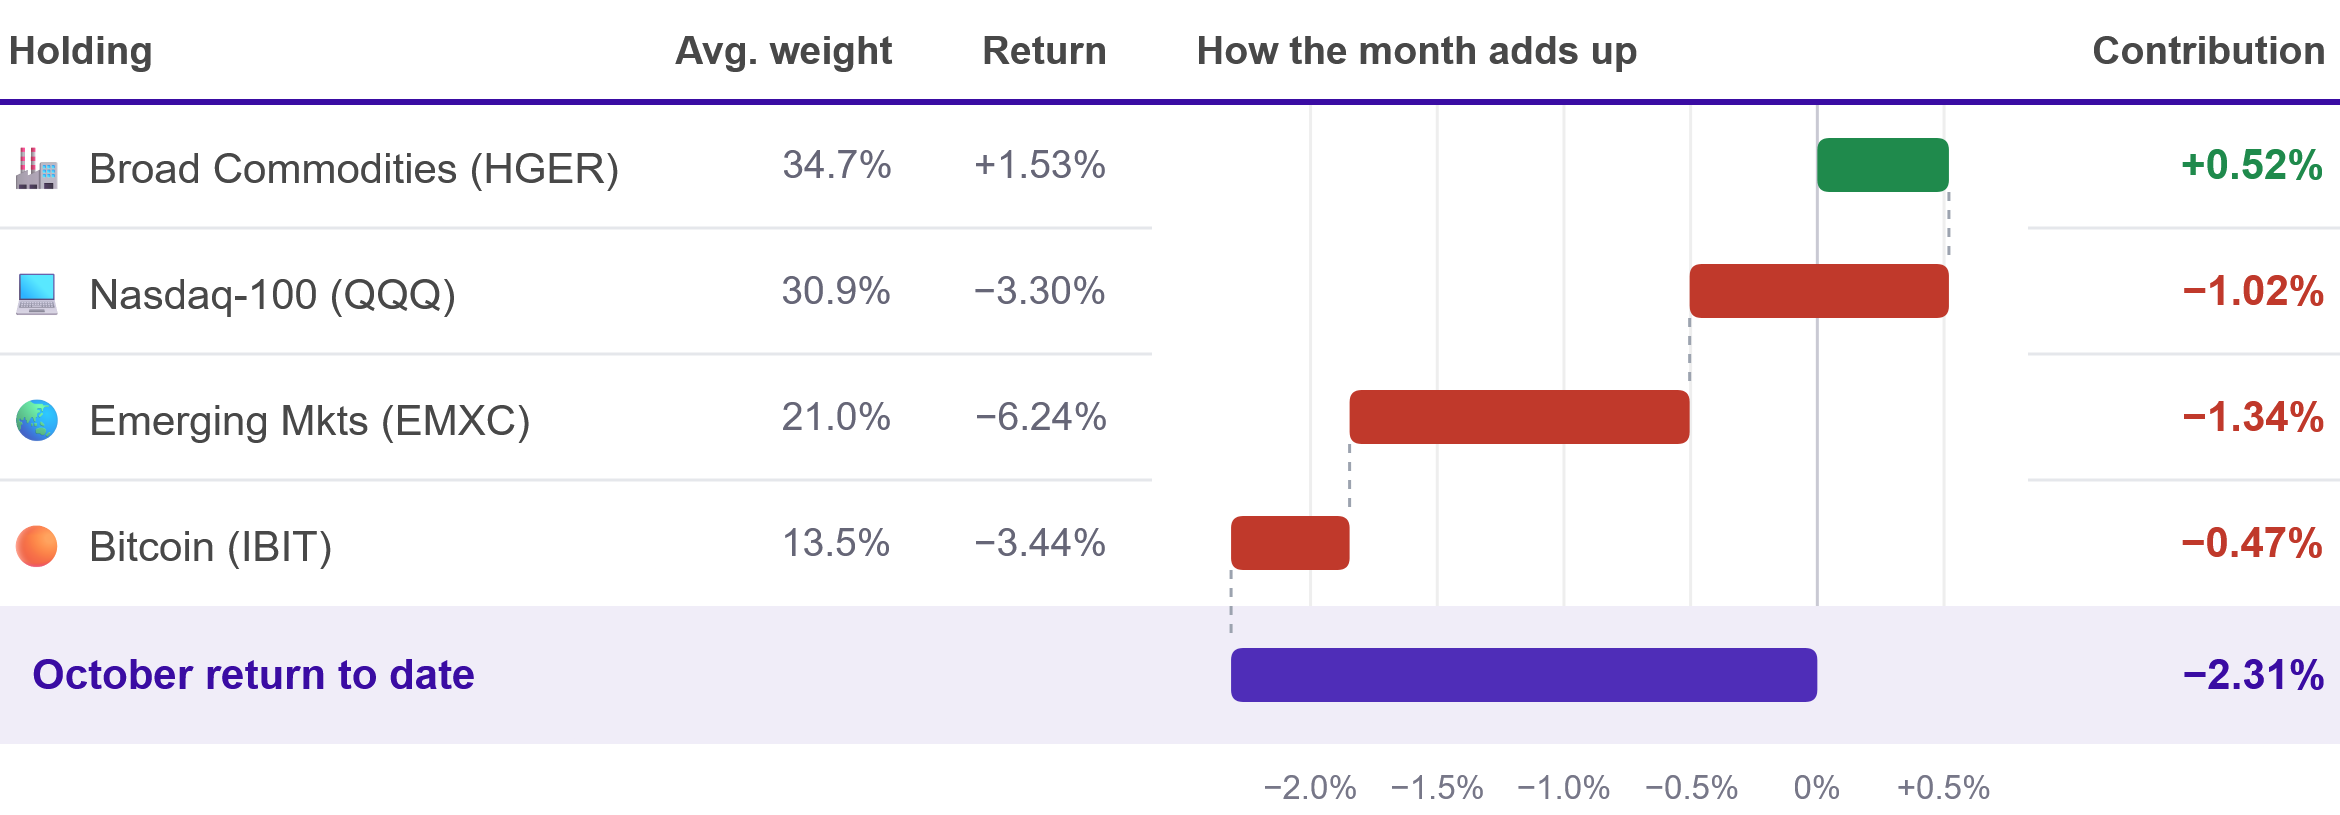
Broad commodities was the only holding to gain, adding 0.52% to the portfolio's return. Emerging markets was the largest drag, costing the portfolio 1.34%, with the Nasdaq-100 close behind at 1.02% and Bitcoin costing another 0.47%.
Year-to-Date Growth of $10,000
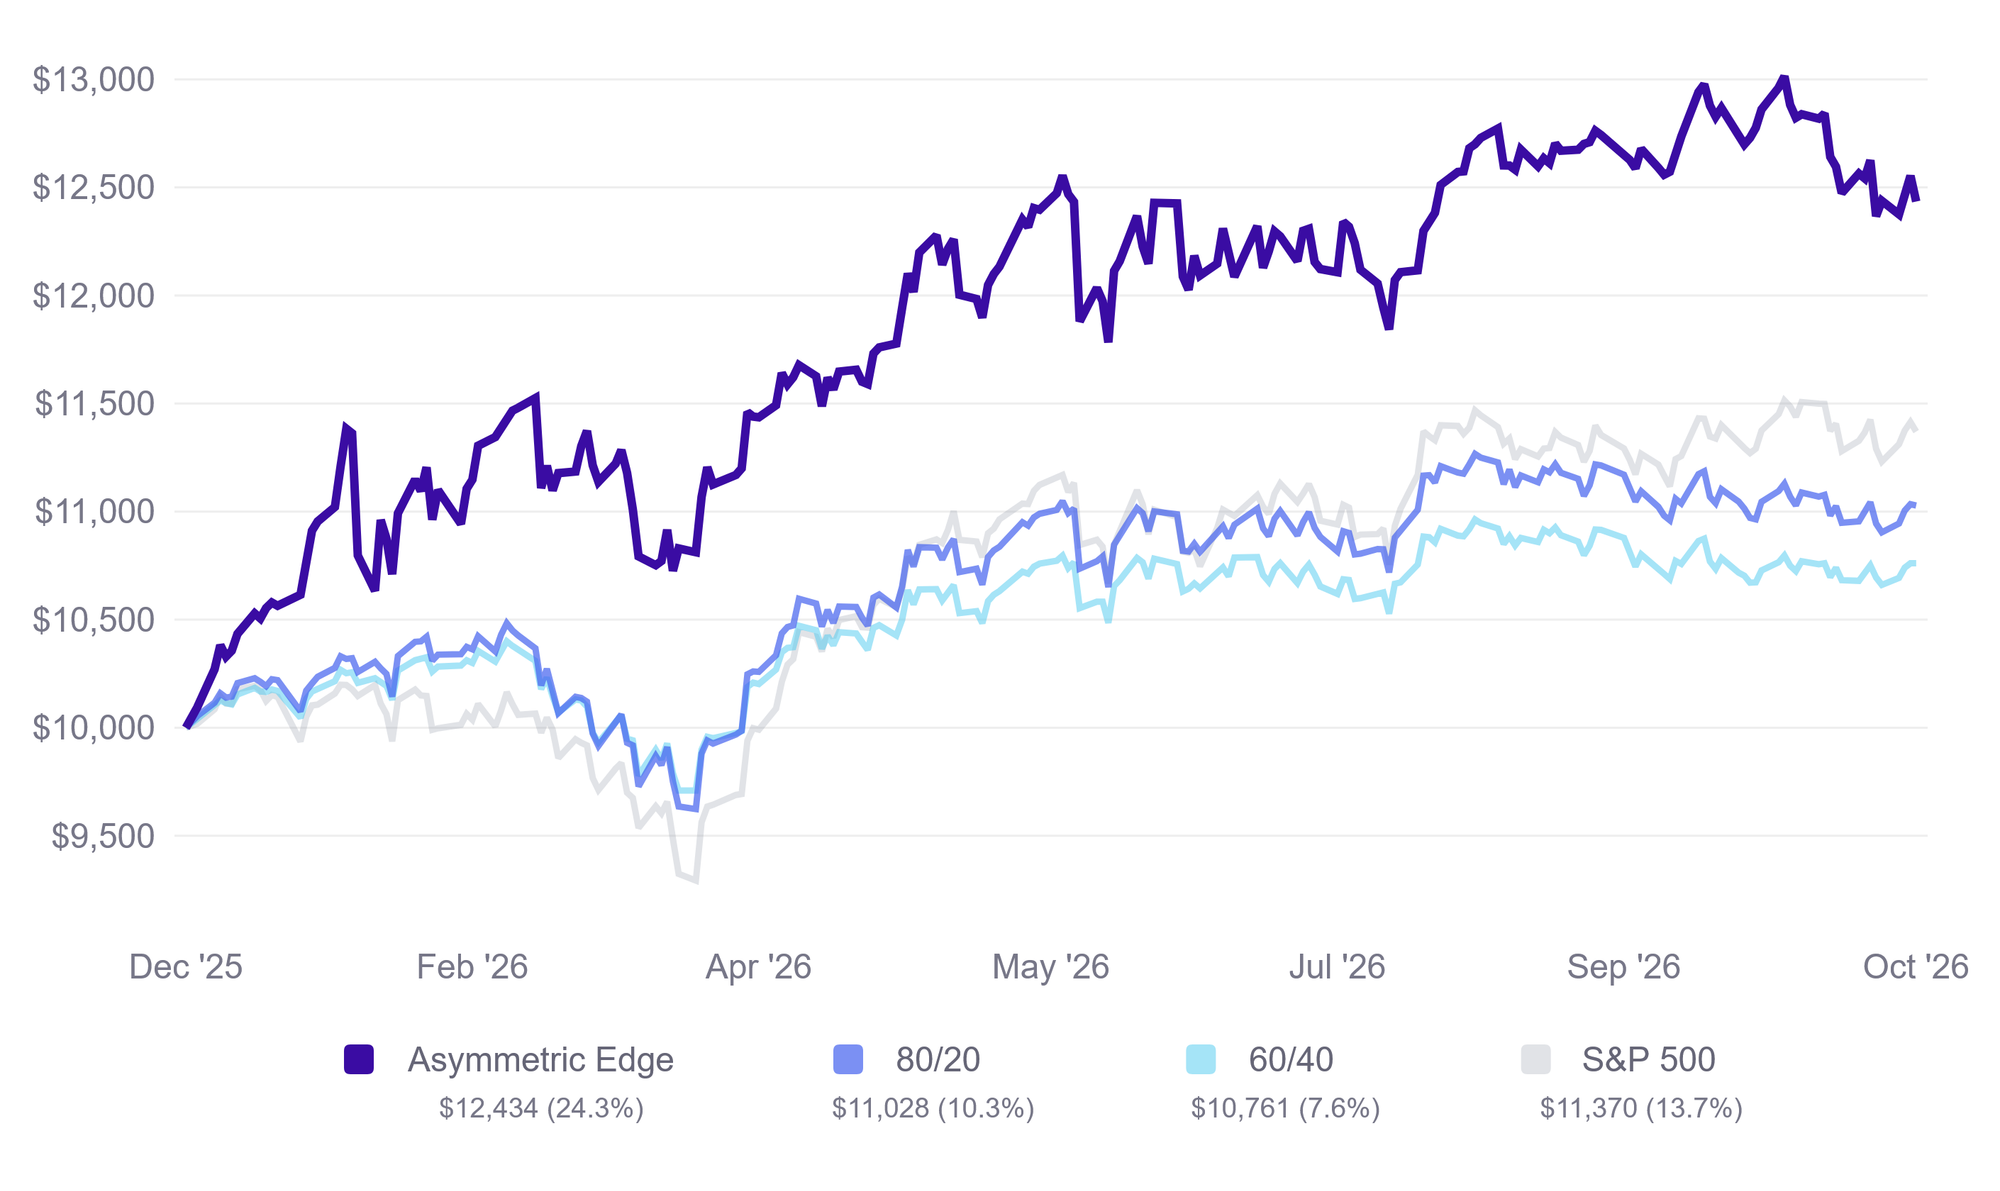
Even after October, the strategy is still more than 10% ahead of the S&P 500 for the year (24.34% vs. 13.70%).
Year-to-Date Asset Class Returns
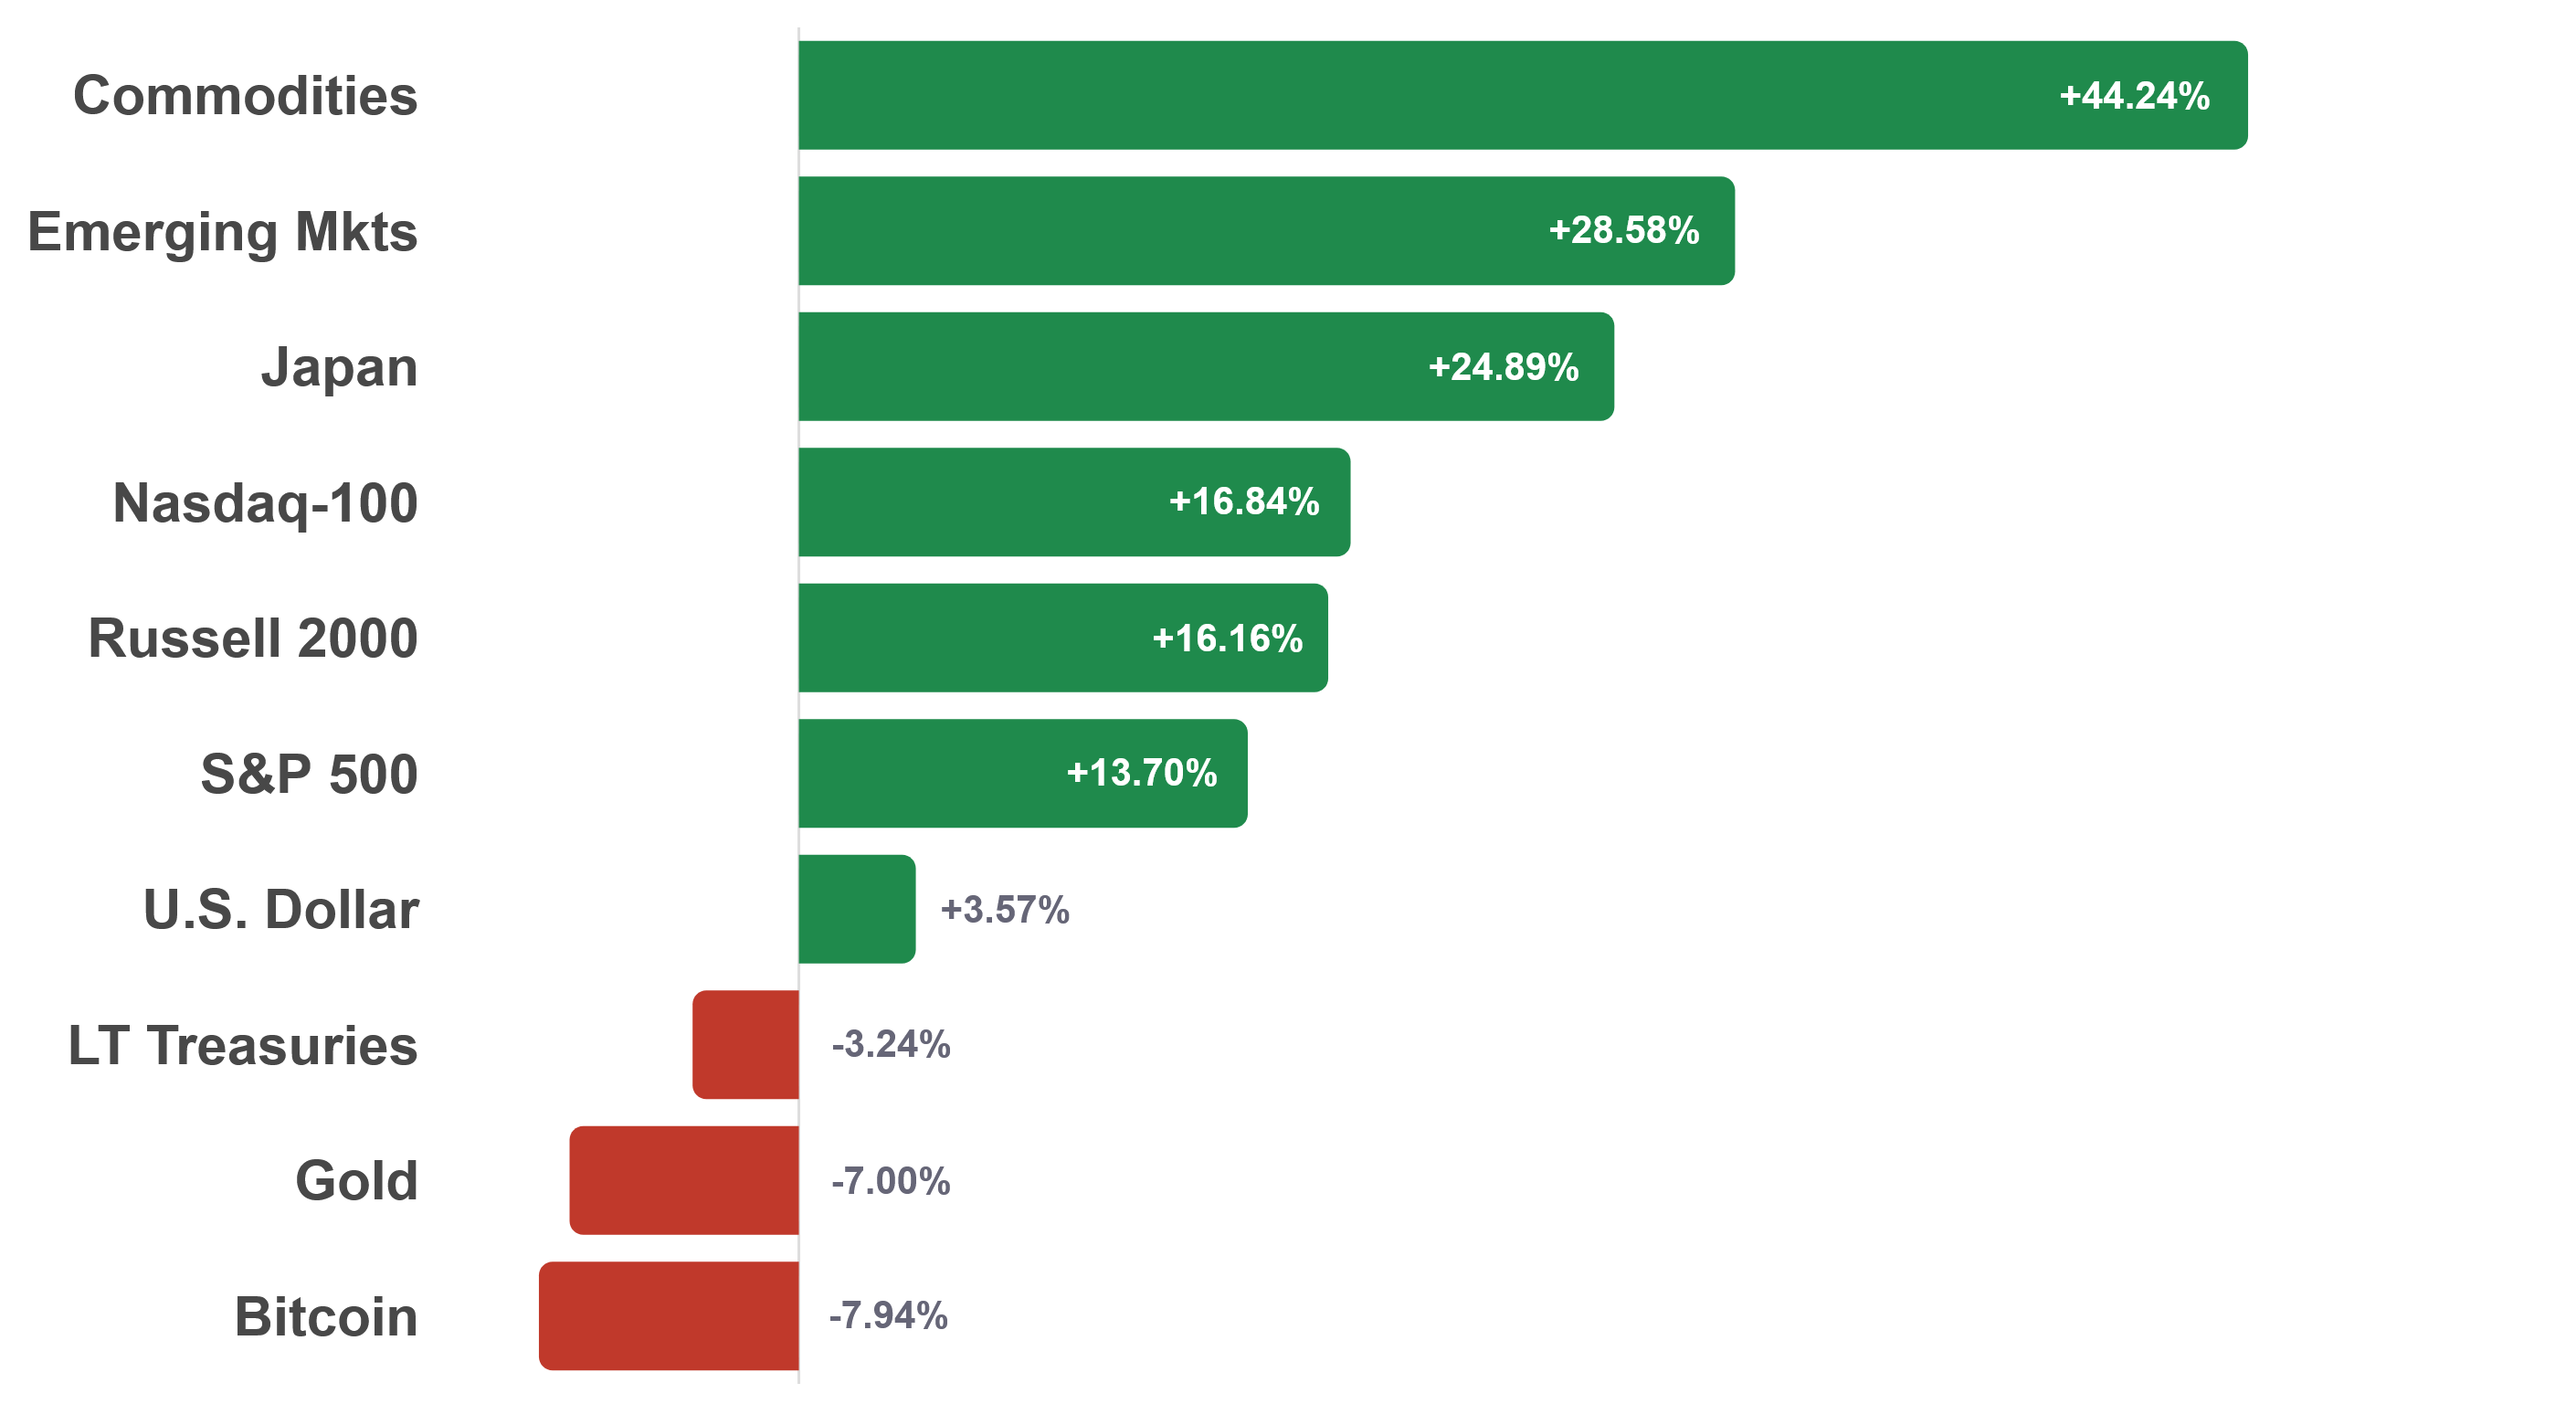
Commodities still lead the year by a wide margin. Emerging markets gave back a big chunk of its gain in October, and Bitcoin is now the weakest asset on the chart.
Brief Market Commentary
Investors punished AI spending. Alphabet fell 12.64% on Thursday after search growth disappointed and the company spent more cash than it brought in. That evening, Amazon and Intel tanked in after-hours trading on their own earnings reports. All three are in the Nasdaq-100, which made up about 31% of my portfolio in October and was already down 3.30% for the month before Thursday night's selloff.
Small caps rose while tech fell. The Russell 2000, an index of about 2,000 smaller U.S. companies, gained 2.20% in October as the Nasdaq-100 dropped. Thursday showed the same split, with the Russell 2000 up about 1% and the Nasdaq-100 down about 1.4%.
Oil climbed, gold slid, and commodities held up. Brent crude settled at $116.72 on October 23rd, its highest since April, after Yemen's Houthi rebels stepped up attacks on Saudi Arabia. Gold fell below $4,000 the same week. Broad commodities (HGER) still gained 1.53% for the month—oil and fuel make up about 44% of the index it tracks, and gold only about 18%.
What I'm Watching
I'm watching whether the selloff in big tech spreads. So far it's been narrow, with most stocks rising on Thursday even as a few giants fell hard. Oil is also on my radar. The U.S. Energy Information Administration expects Brent to average about $105 a barrel through the end of the year.
Will Thursday's tech selloff turn into something bigger? I don't know. If it does, it'll show up in my strategy's momentum readings, and the portfolio allocations will shift accordingly.
Below for paid members:
- The four ETFs I'm holding for November, with exact weights
- The one holding that exits, and what takes its place
- How my portfolio allocations shifted from the start of October