No Bonds, No U.S. Stocks, and a Likely Rate Hike Tomorrow
The Asymmetric Edge strategy is up 25.9% year-to-date against 10.2% for an 80/20 portfolio, and it enters Fed week holding no bonds and no U.S. stocks. Inside: what oil above $100 and a hot producer-price print mean for my four positions, plus the four environments that decide which assets lead.


The Asymmetric Edge strategy is up 25.9% year-to-date, more than double the 10.2% return of an 80/20 portfolio over the same period. Two weeks into September the strategy is roughly flat while both benchmarks are down about 1%, weighed down by bonds, which sold off this month. The strategy, which does not currently hold any bonds, was spared.
This issue covers what oil's return above $100, a hot producer-price print, and a likely rate hike did to the four positions I hold. The deep dive maps the four economic environments investors move through, and where things currently sit on that map.
📌 This newsletter documents how I invest my own money with a simple, rules-based strategy. The aim is to match a traditional balanced portfolio with shallower drawdowns, and I share what I hold and why so you can watch it play out.
What Moved
- 🏛️ Rate-hike odds for Wednesday climbed to roughly 90%, from a coin flip in early August. A hike would be the first of this cycle.
- 🛢️ Brent crude went back above $100, trading near $110 on Monday after new U.S. and Iranian strikes on tankers and a weekend attack on a Saudi pipeline.
- 💼 August payrolls rose 162,000 against roughly 53,000 expected, with unemployment steady at 4.1% and wages growing slower than prices.
Theme of the Month
This is one of four combinations an economy can be in, depending on whether growth and inflation are each rising or falling. Right now producer prices are accelerating, consumer prices are running at 3.4%, and payrolls are still growing. Historically that combination has tended to favor commodities and real assets over bonds, and it is the quadrant I spend the most time on in the deep dive.
One Number That Matters
Average hourly earnings grew 3.1% over the past year while consumer prices rose 3.4%, according to the August jobs report and the August CPI release. Paychecks are growing but buying less.
Market Moves
Portfolio and Benchmark Returns
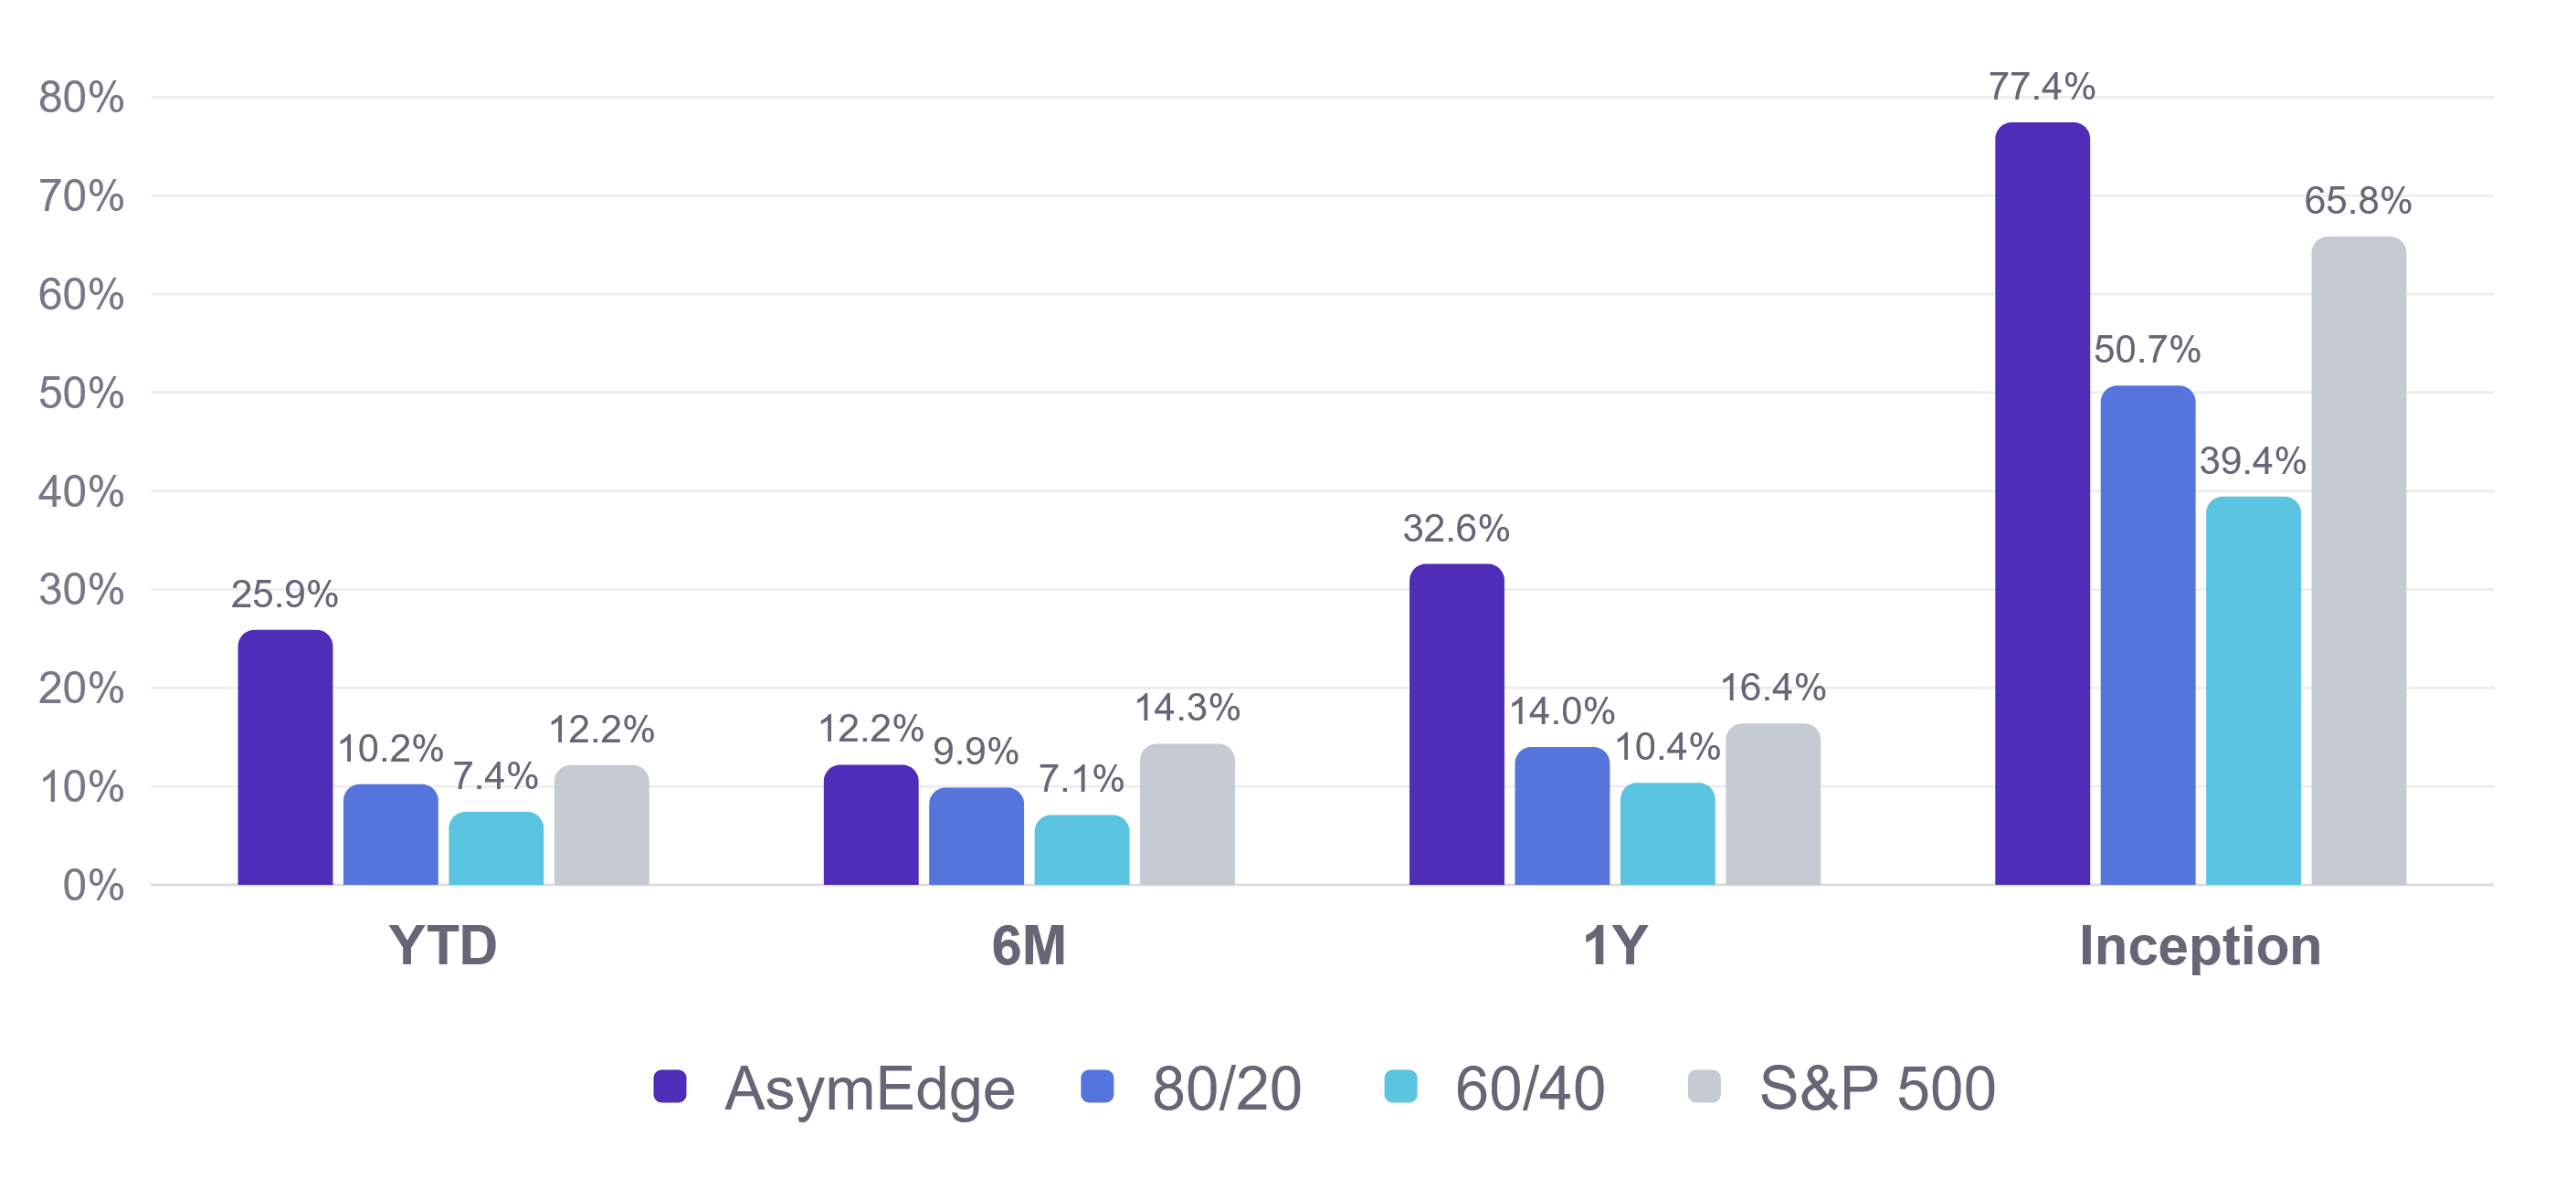
So far, September is a wash. The strategy is down about 0.15% for the month through Monday's close, against a 1.16% decline for an 80/20 portfolio and a 0.80% decline for the S&P 500. While it may not be exciting, I am fine with flat performance, especially when benchmarks are declining.
The one period the strategy still trails the S&P 500 is the six-month window, where the index leads 14.3% to 12.2%. That window starts in mid-March, right after stocks sold off hard. U.S. stocks then rebounded just as quickly, leaving other assets in the dust through April.
Charting the Growth of $10,000
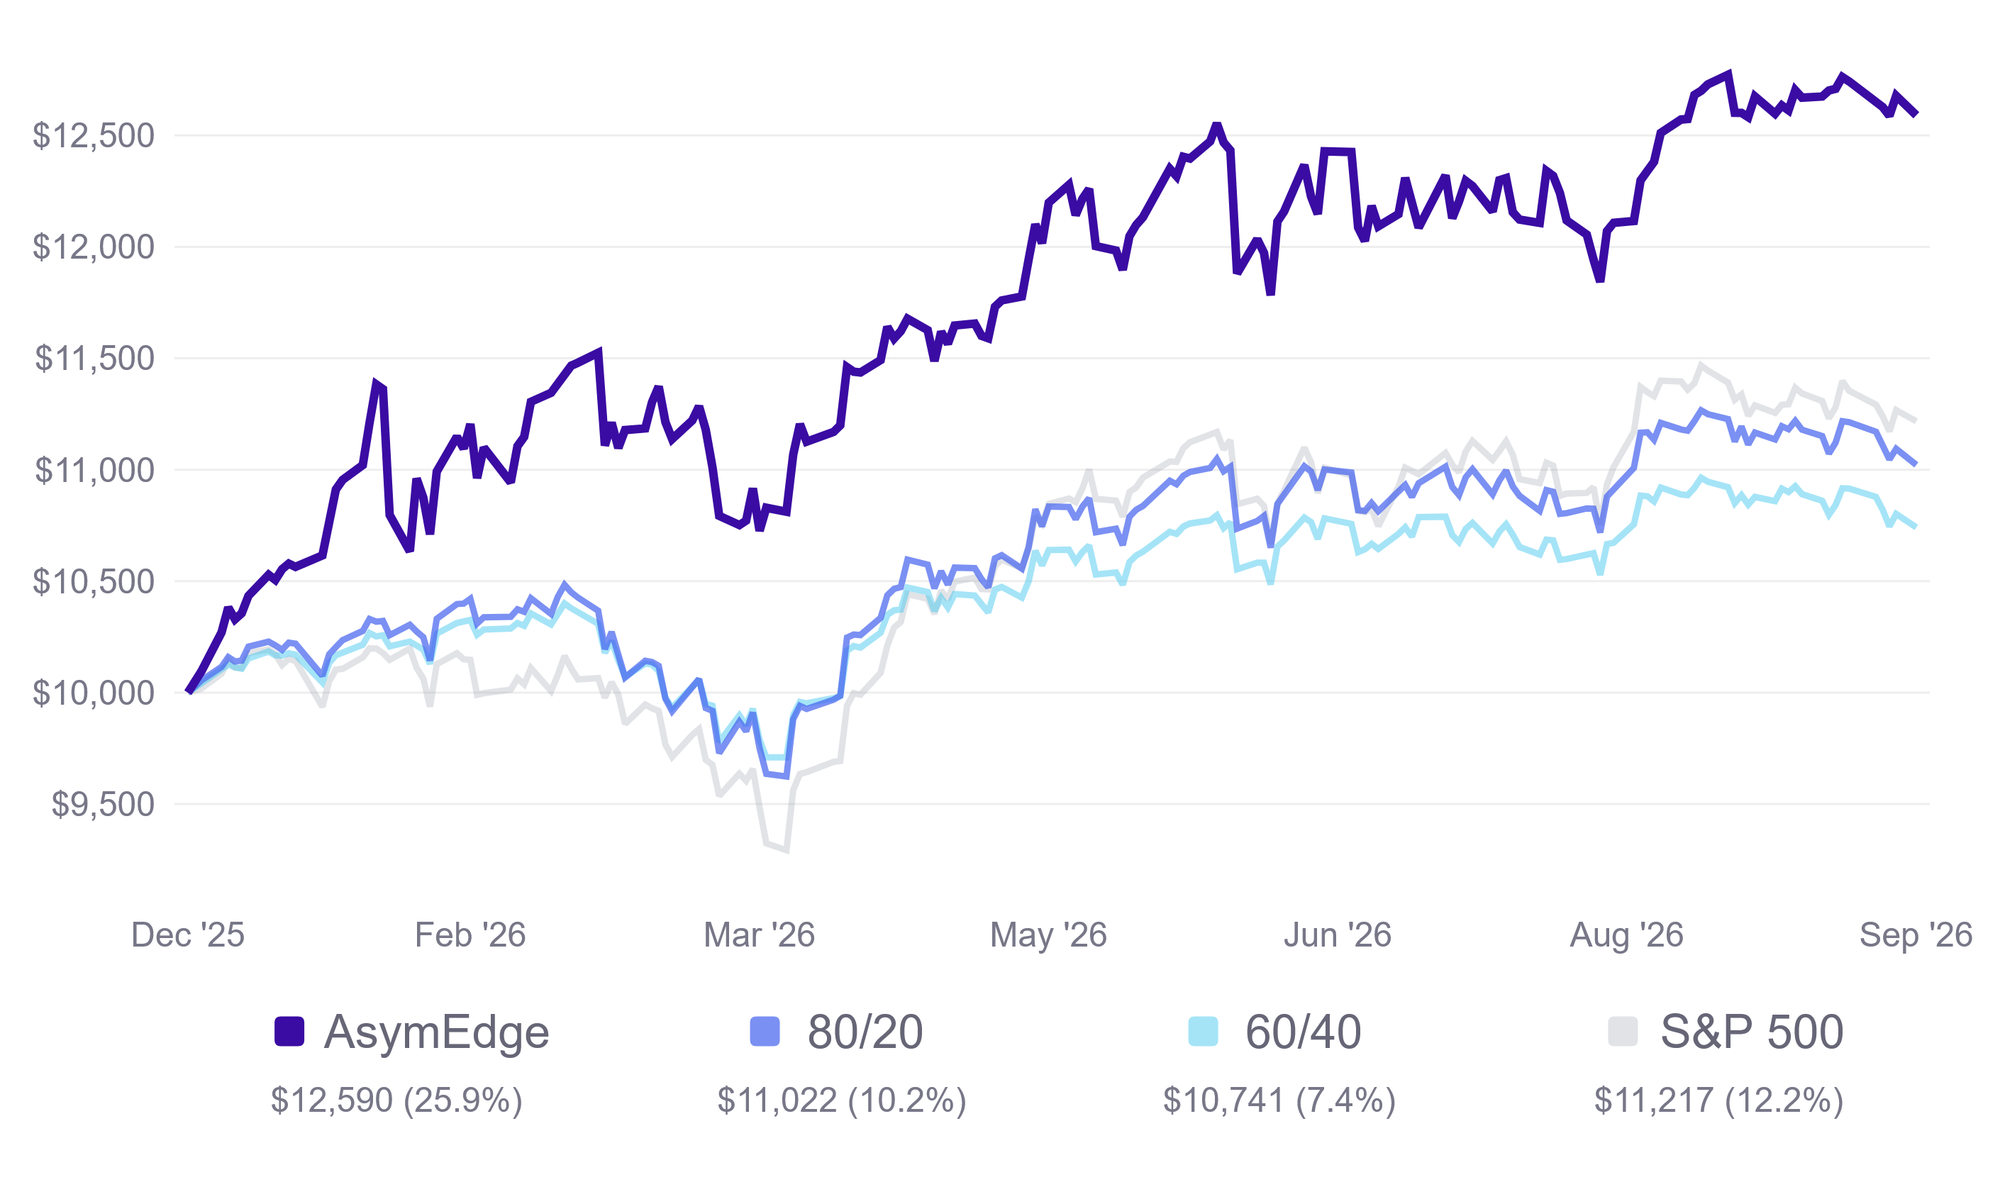
Ten thousand dollars invested at the start of this year would be worth about $12,590 in the strategy, against $11,217 in the S&P 500 and $11,022 in an 80/20 portfolio. Held since the strategy went live in January 2024, the same $10,000 would be roughly $17,745 versus $16,584 in the S&P 500.
Year-to-Date Asset Class Returns
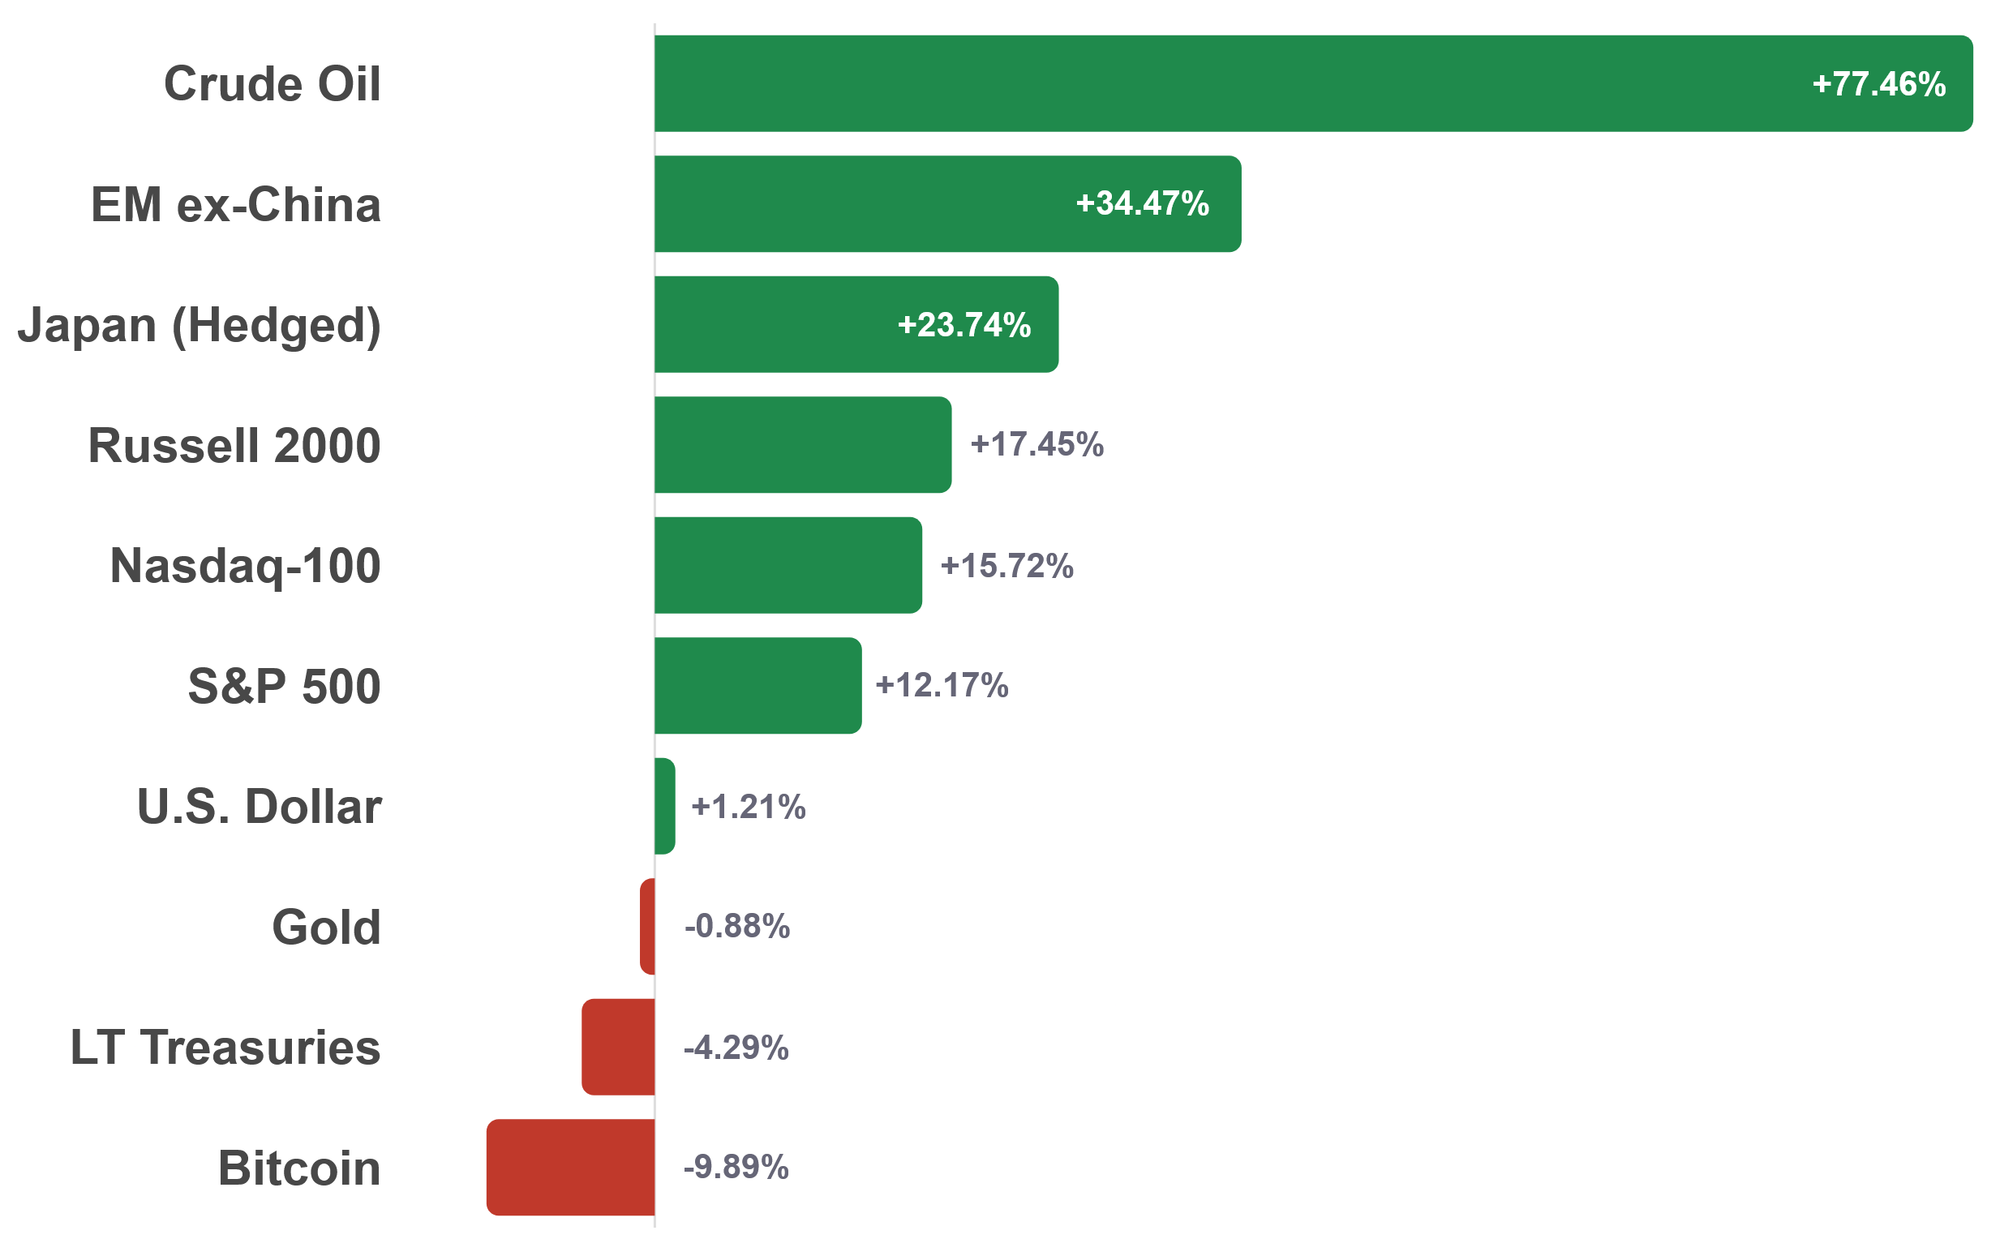
Crude oil has nearly doubled in 2026 and gold is slightly negative, an unusual pairing. Both are 'inflation hedges' in the textbook sense, and only one of them has hedged anything this year. Long-term Treasuries are down 4.29% and remain the second-worst performer I track, a reminder that the bond portion of a traditional stocks-and-bonds portfolio has been a drag on performance this year.
Portfolio Allocations
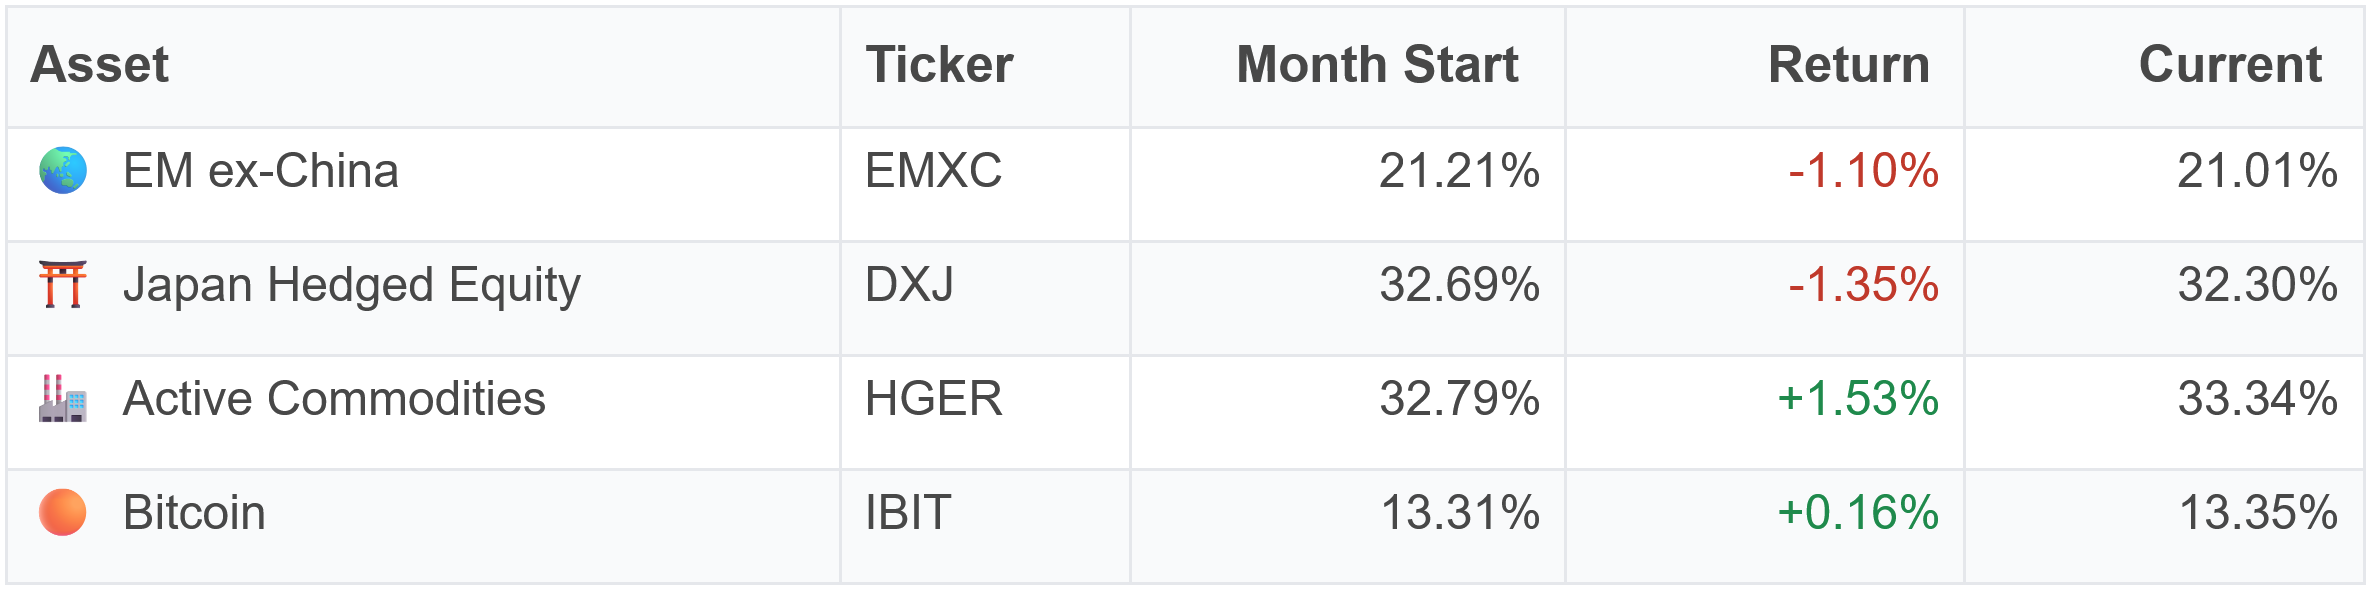
Two positions are up and two are down, and the net is the roughly 0.15% dip I mentioned earlier. Japan hedged equity has given back 1.35% this month as Japanese stocks sold off on oil and rising global yields.
What Is Inside the Commodity Position
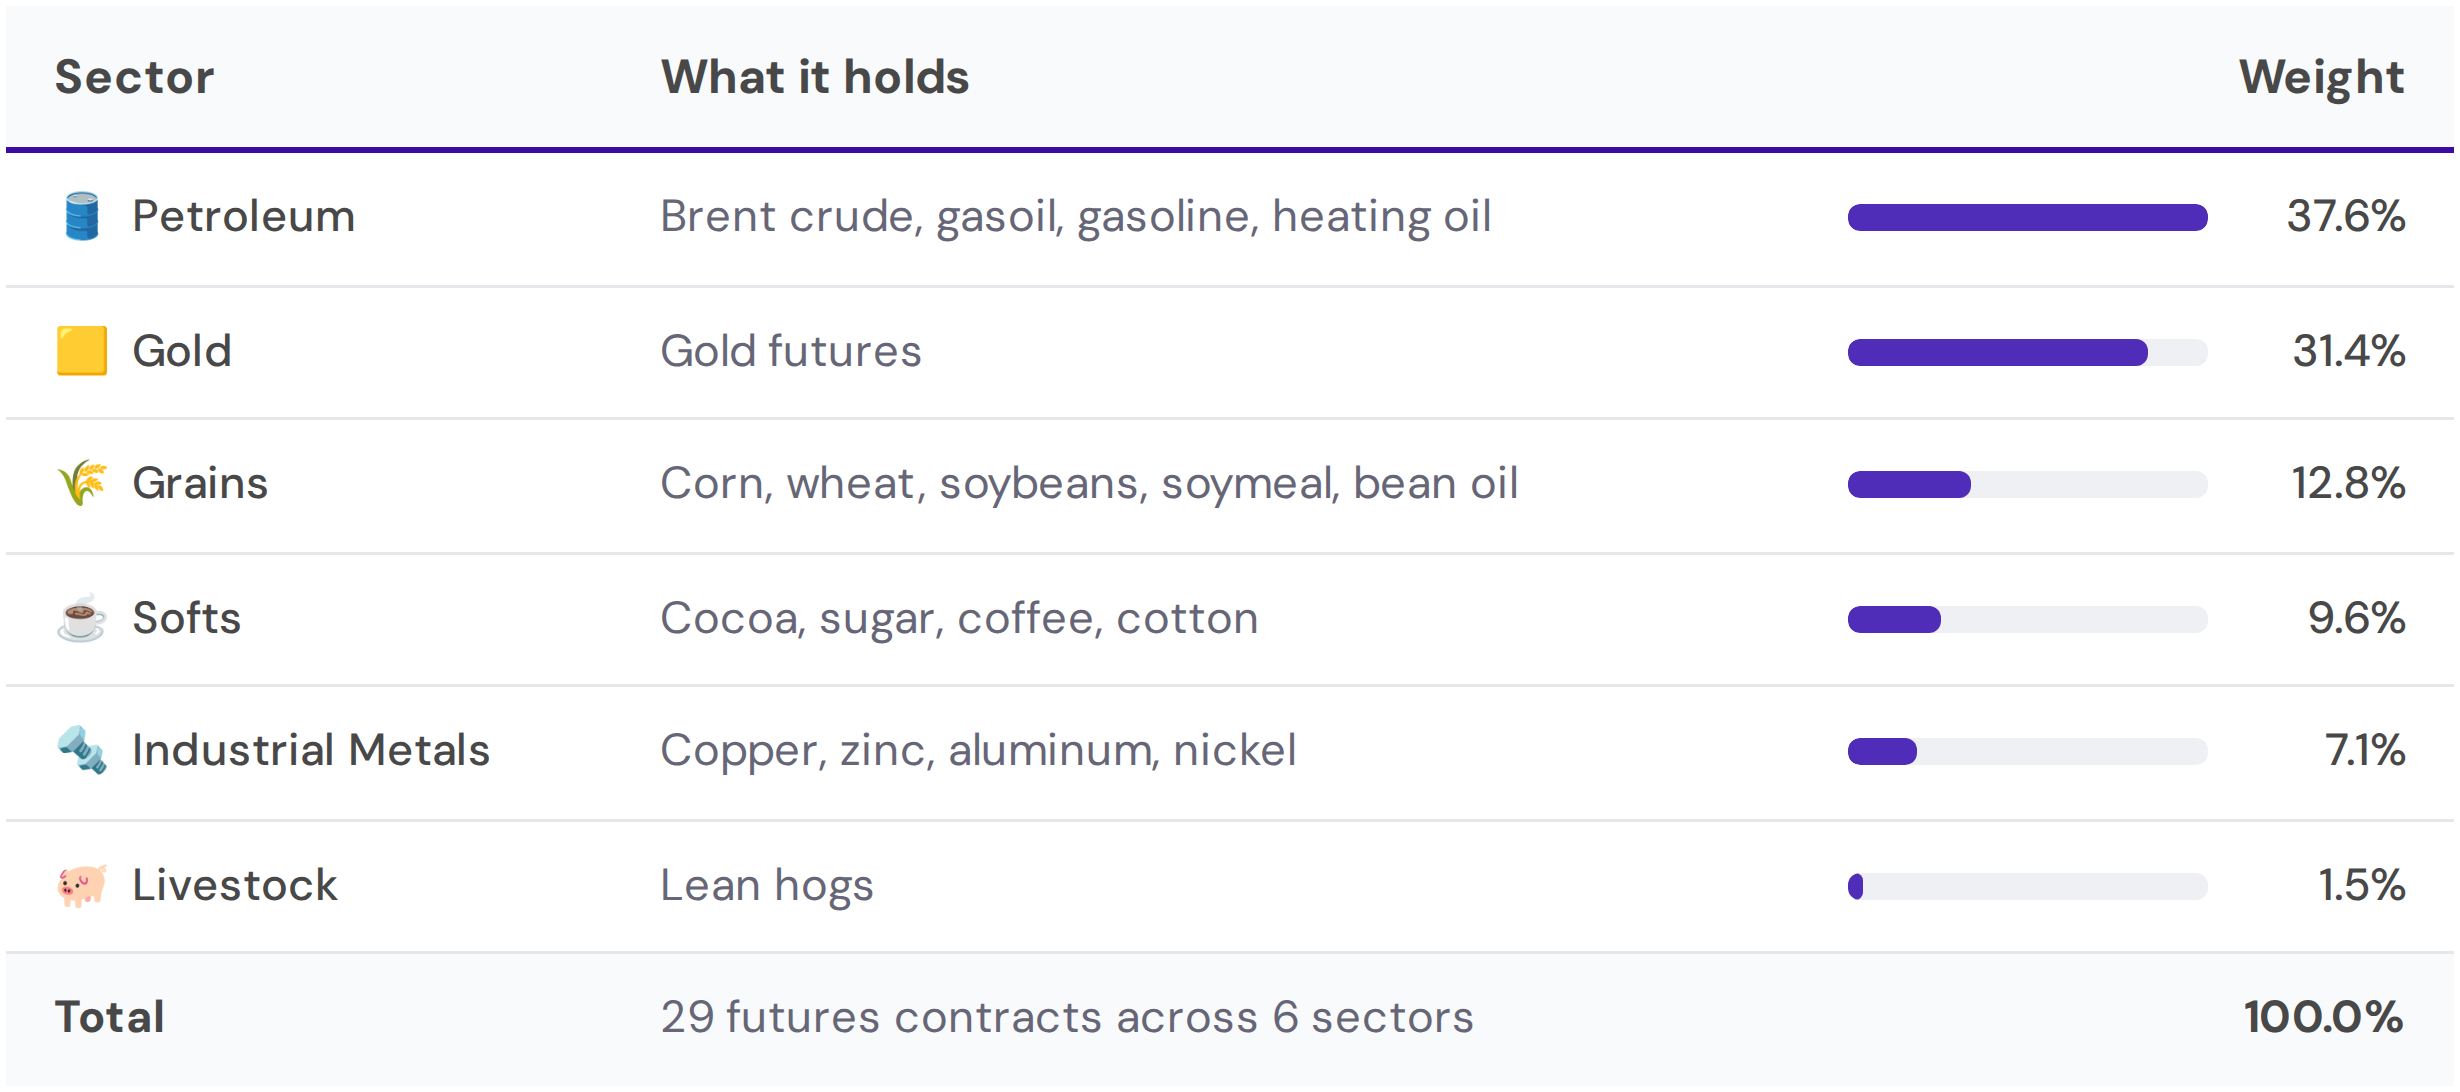
Active commodities (ticker HGER) is my largest position at 33.34%, and it helps to know what this actively managed ETF currently holds. Unlike a fund that mechanically tracks an index, HGER is actively managed: its managers decide which commodities to hold and how heavily to weight each one.
As of September 14, petroleum products (Brent crude, gasoil, gasoline, and heating oil) make up the largest slice at roughly 38%, with gold close behind as the single largest holding at 31.4%. Grains are about 13%, softs about 10%, and industrial metals about 7%.
That composition explains the month. Petroleum did the heavy lifting. Brent crude approached $108 on September 11 after U.S. strikes on Iranian tankers, then a weekend attack on a Saudi pipeline pushed it near $110 on Monday, carrying the position to a 1.53% gain so far this month.
Gold did the opposite, giving back about 2% as Treasury yields jumped. At nearly a third of HGER, that acted as a counterbalance to oil's strength. Copper's record $14,533 a metric ton made headlines, but at under 2% of the index, it did little to boost returns.
Two Markets Inside Emerging Markets
Emerging markets ex-China (ticker EMXC) is still up 34.47% on the year, though one bad session erased the month's gain. It was up 2.39% for September through Friday, then fell about 3.4% on Monday and is now down 1.10% for the month.
South Korea is most of that story. The Kospi jumped 4.61% on September 8 as memory-chip makers rallied on a new OpenAI model, then fell 3.26% on Monday on reports that OpenAI is delaying its IPO, a round trip in a single week. What reached my account was a 1.10% dip, not the full swing, which is the case for owning the basket rather than the country.
Bitcoin, Two Weeks In
Bitcoin (ticker IBIT) rejoined the portfolio on August 31 after nine months out, and its first two weeks back have been a round trip to nowhere, up 0.16% for the month after spot Bitcoin ETFs took in a record $730.8 million on September 3 and gave back about $463 million the following week.
Bitcoin was sized at 13.31% on purpose. It moves several times as much day to day as my other three positions, so risk parity gives it the smallest slice, and a week of 2% swings barely registers at the portfolio level.

Fed Week
Markets are pricing roughly a 90% chance the Fed raises rates on Wednesday, which would take the federal funds rate to a range of 3.75% to 4.00%, the first increase of this cycle. Odds sat near a coin flip in early August. This month's data pushed them higher. August producer prices rose 5.4% year-over-year, up from 4.8% in July and above the 5.3% consensus. Then payrolls came in at 162,000 against roughly 53,000 expected, with June and July revised up by a combined 55,000.
A strong jobs number and hot producer prices take away the two reasons the Fed had for waiting. I hold no bonds, so a hike would not hurt the portfolio directly. What it would do to the assets I do hold is a different question, one the deep dive explores.

Deep Dive: The Four Economic Environments
There are only four kinds of economic weather, at least in the version of the map I find most useful. Growth is either rising or falling, and inflation is either rising or falling. Put those two on a grid and you get four quadrants, and most of what happens to a portfolio over a year comes down to which quadrant the economy is in and which one it is moving toward.
The map
The framework comes from Bridgewater's All Weather work, which starts from a simple observation: Any asset's price is mostly a bet on future growth and future inflation, so price movements result from surprises in either. The idea is not to guess which quadrant the economy moves into next. It is to know which assets have historically done well in each one, and to hold a mix that can rotate as conditions change.
The four boxes, using the same labels as the graphic below:
- Goldilocks, growth up and inflation down. Most of the 2010s. Stocks lead, Bitcoin has tended to trade like a high-octane stock, and almost everything works.
- Overheating, growth up and inflation up. Stocks can still go up, but broad commodities have historically led, and nominal bonds lag.
- Deflation, growth down and inflation down. A recession with falling prices. Long-term Treasuries have historically done best.
- Stagflation, growth down and inflation up. The 1970s is a prime example of this. Gold and broad commodities led, and stocks and bonds both struggled.
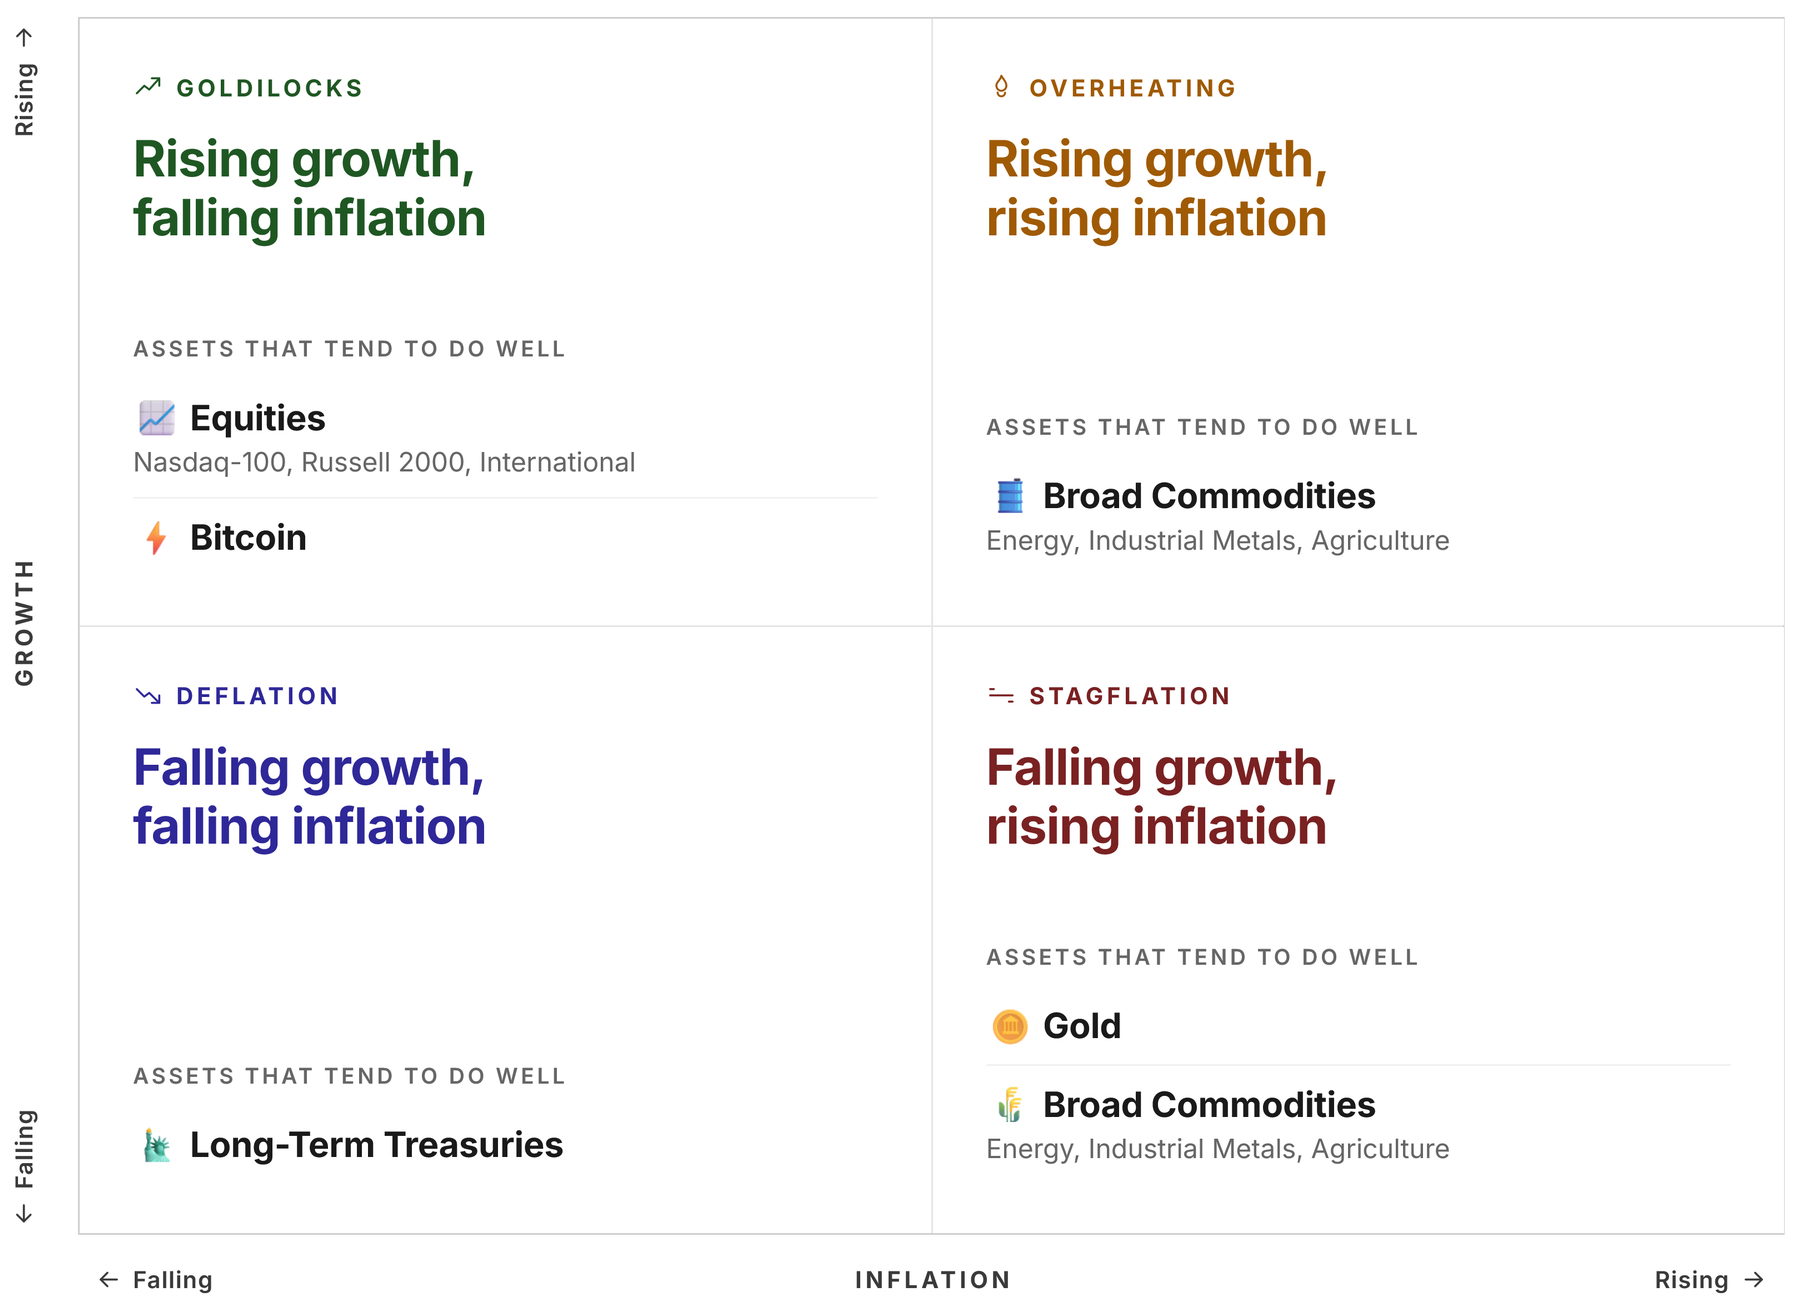
These are tendencies drawn from history, not laws. Any given year can break the pattern, and 2026 has already broken one, with gold flat in an inflationary year.
The quadrant we are in
This month's data points at the top-right quadrant, with growth maintaining and inflation rising. Producer prices are accelerating, consumer prices are up 3.4%, and payrolls grew 162,000 against a twelve-month average near 31,000.
The nuance is in the wage number. Earnings are up 3.1%, but prices up 3.4%. This means real incomes are slipping even as jobs increase, which is how "inflation up" starts drifting toward "growth down."
How my strategy's rankings interact with the quadrants
My strategy does not know what quadrant the economy is in. It ranks ten ETFs on relative strength each month and holds the top four, sized so each carries similar risk. What is important is that, within my basket of available ETFs, it can pull from assets which have performed well in each of the four economic conditions.
Assets that have done well in each economic environment
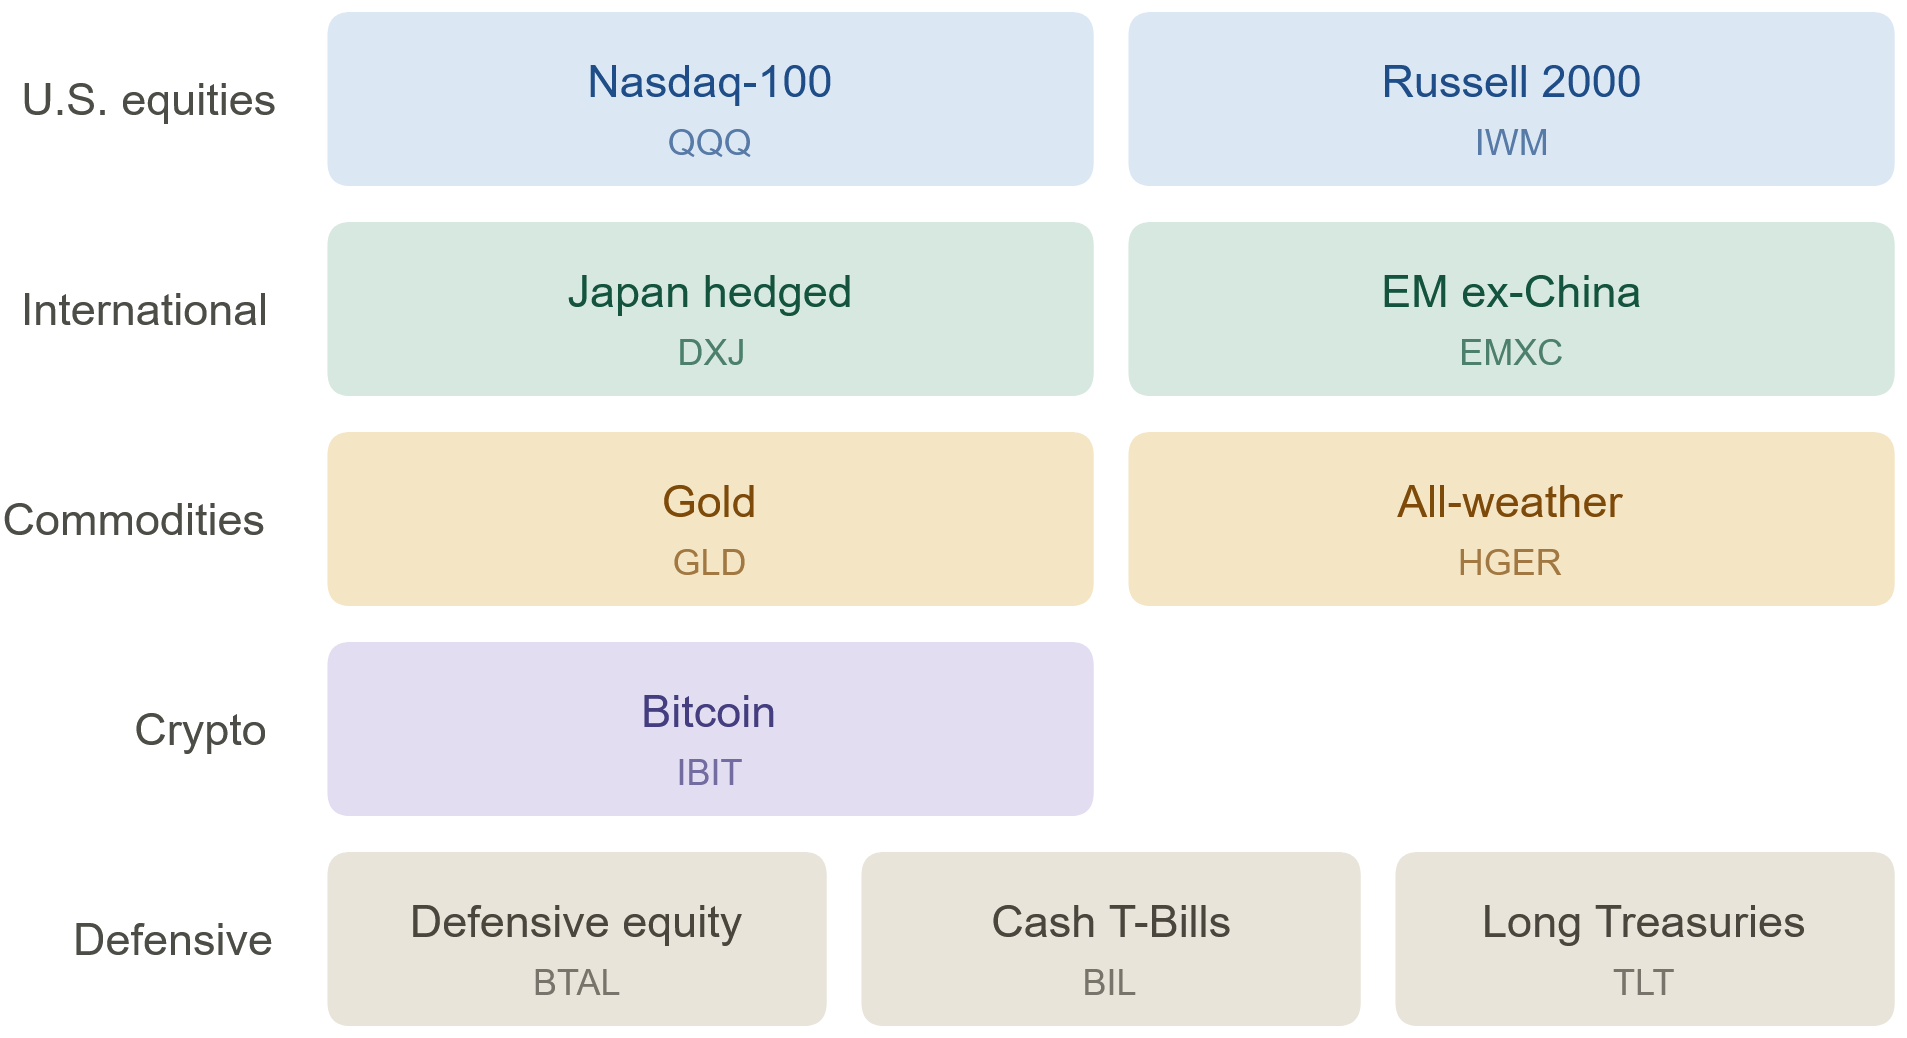
Lay the August 31 portfolio over the map and it spans two boxes. About a third is broad commodities, the overheating asset. The other two-thirds, Japan hedged equity, emerging markets ex-China, and Bitcoin, are Goldilocks assets, which lead when growth is rising and inflation is not the problem. Nothing comes from the bottom row, no long-term Treasuries and no gold.
Read that way, the rankings say the growth half of the story is intact, and the commodity position is the part responding to inflation. That fits the year so far, with emerging markets ex-China and Japan up 34.47% and 23.74% year-to-date, while gold, the stagflation asset, lost momentum in March and has not rejoined the portfolio since.
This is not a macro forecast. The strategy's systematized rankings put commodities at the top in early 2026, well before this month's producer-price print, and would drop them just as mechanically if the trend turned. The map explains why the portfolio looks the way it does. Following momentum shifts across asset classes is what built it.
What the map cannot do
Boxes get labeled in hindsight. Nobody rang a bell when the economy left "growth up, inflation down," and nobody will ring one when conditions inevitably shift.
The map also shows where the portfolio is exposed. If the wage squeeze pushes the economy down toward stagflation, the two-thirds in the growth boxes could get hit first, and the rankings would only react after prices had moved.
That lag is the cost of not forecasting, and I pay it on purpose. I would rather be a step late in the right direction than early and wrong.
You can't predict. You can prepare. - Howard Marks
That line is the title of a 2001 Oaktree memo, and it is the whole deep dive in six words. The map does not tell me what comes next. It tells me what tends to work when we shift into a different economic quadrant.
Wrap Up
A Fed decision tomorrow that the market has priced as a hike, oil above $100, and the S&P 500 slipping below its 50-day average in the same week is the kind of stretch that makes people want to do something. I own no bonds and no U.S. stocks going into it. A rules-based process got me here and it is what makes a week like this easier to sit through.
If the environment turns, the strategy will become more defensively positioned in its own time, one rebalance at a time, without needing me to call the turn. I will see you at the end of the month with the October allocations.

Disclaimer & Disclosure
This newsletter is for informational purposes only and does not constitute financial advice, investment recommendations, or an offer to sell or buy any securities. The content is published as a journal of the author’s personal investment activities and is intended for a general audience.
No Investment Advice: The author is not a financial advisor. You should not treat any opinion expressed herein as a specific inducement to make a particular investment or follow a particular strategy, but only as an expression of opinion.
Risk Warning: Investment involves risk, including the possible loss of principal. Past performance is not indicative of future results. No investment strategy or risk management technique can guarantee returns or eliminate risk in any market environment.
Data & Accuracy: Information contained herein has been obtained from sources believed to be reliable, but its accuracy and completeness are not guaranteed. All expressions of opinion are subject to change without notice in reaction to shifting market conditions.
Positions: The author currently holds positions in the securities mentioned in this newsletter. The author may buy or sell these securities at any time without notice.
Copyright: This content is provided solely for the personal use of the subscriber. Any unauthorized copying, forwarding, or distribution of this material is prohibited without prior written consent.