Holding Steady Through the Storm
Markets sold off sharply in March as the Iran conflict deepened and oil surged past $100 a barrel. The Asymmetric Edge strategy gave back some ground but is still up 8% year-to-date, while the S&P 500 is down 7% over the same period. Here are my allocations heading into April.


The Asymmetric Edge strategy is up 8.1% year-to-date, outperforming the S&P 500 by more than 15 percentage points. Here are my allocations heading into April and a few thoughts on what's been an intense month.
📌 This newsletter explains how I invest my own money, using a simple portfolio of four ETFs. I share what I hold and why, so readers can see one real world approach in action.
Portfolio Allocations for April
| Asset | Ticker | Weight | Purpose |
|---|---|---|---|
| 🛢️ Active Commodities | HGER | 29.85% | Broad commodity exposure with inflation sensitivity |
| 🌏 EM ex-China | EMXC | 26.72% | Emerging markets diversification without China risk |
| ⛩️ Japan Hedged Equity | DXJ | 23.84% | International equity exposure with USD/JPY hedge |
| 🟨 Gold | GLD | 19.59% | Inflation and crisis hedge |
The same four ETFs remain at the top of the relative strength rankings, but weights shifted modestly after rebalancing.
Japan hedged equity saw the largest increase, moving from 22.23% to 23.84%, reflecting DXJ's relative resilience through recent volatility. Emerging markets ex-China saw the biggest decrease, dropping from 28.41% to 26.72%, as EM assets gave back gains amid a stronger dollar and uncertainty around the Iran conflict's impact on oil-importing nations.
HGER edged down slightly from 30.08% to 29.85%, and gold ticked up from 19.28% to 19.59%. Small, systematic adjustments from rebalancing.
Quick Take
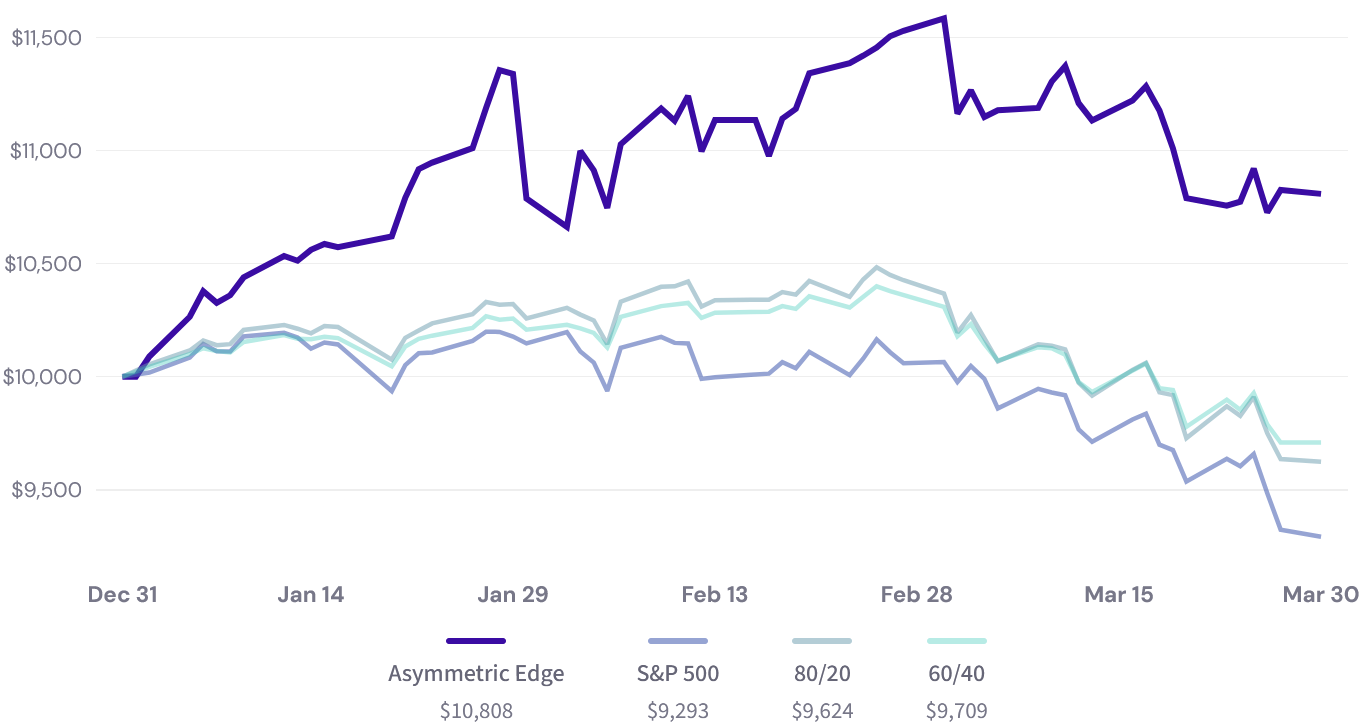
March was painful across the board. The strategy gave back 6.7% this month. The S&P 500 fell 7.7%, the Nasdaq dropped over 9%, and an 80/20 portfolio lost 7.2%.
But the year-to-date gap tells a different story. A hypothetical $10,000 invested at the start of the year would now be worth roughly $10,808 versus $9,293 in the S&P 500.
Charting the Growth of $10,000
Year-to-Date
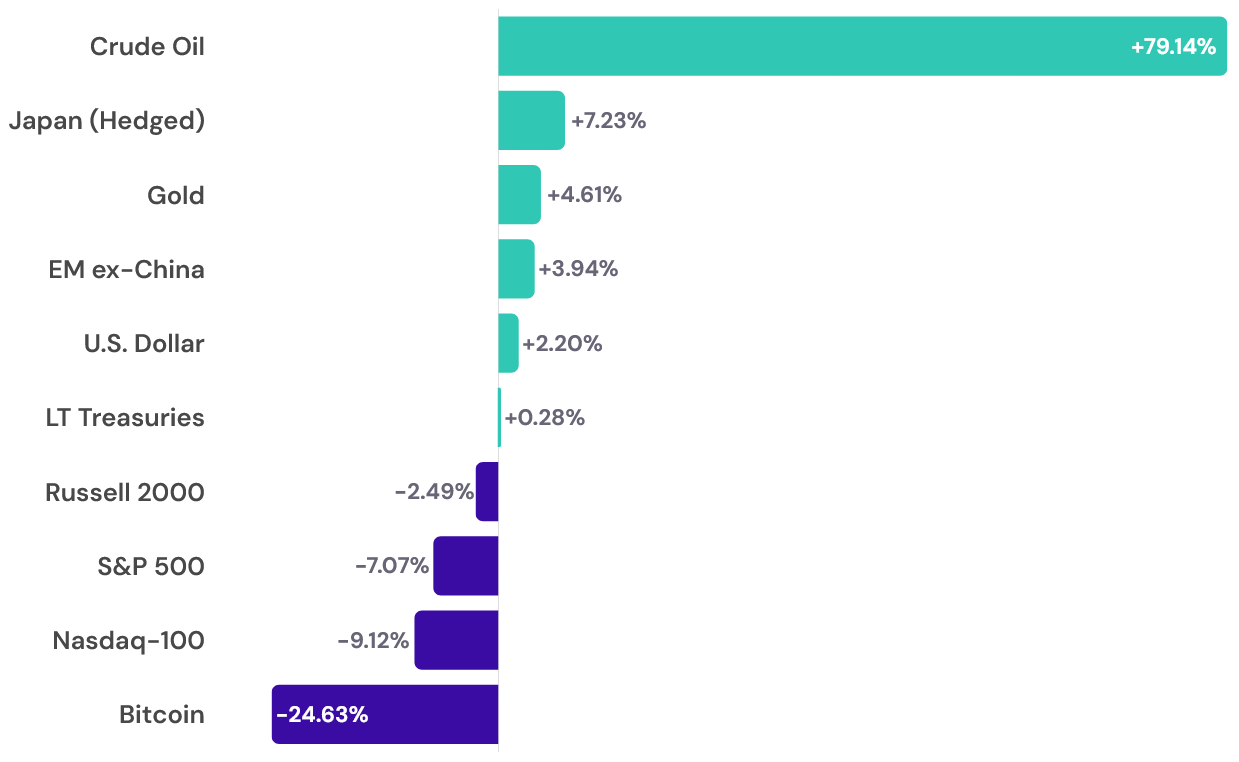
The Iran conflict continues to dominate. Since the U.S. and Israel launched strikes on February 28, the effective closure of the Strait of Hormuz has disrupted roughly 20% of the world's seaborne oil supply. Crude oil is now up over 79% year-to-date. Analysts warn that if the strait isn't reopened by mid-April, the disruption could get significantly worse.
This has been a direct tailwind for HGER (Harbor Commodity All-Weather Strategy ETF), which holds a diversified mix of commodity futures spanning precious metals, petroleum, industrial metals, grains, and softs. The fund's internal positioning has shifted notably over the past month with petroleum exposure increasing from about 30% to 39% of the fund, while gold dropped from roughly 42% to 34%. That rotation toward oil happened automatically through HGER's inflation-sensitivity model.
Gold took a beating this month. Starting around March 12, gold fell roughly 17% in about two weeks, dropping from over $5,100 to around $4,100 before bouncing back to around $4,500. You might expect gold to rally during a war, but the opposite happened here. The dollar surged on safe-haven demand, Treasury yields climbed, and surging oil made Fed rate cuts less likely, all of which hurt non-yielding assets like gold. Institutions also took profits after the massive run from 2025.
Despite the pullback, gold is still positive on the year at about 4.6% and up roughly 48% over the past 12 months. Even after the drop, it lands firmly in third place among the assets I track when measured across the lookback periods I use to rank momentum. It has weakened, but it still earns its spot in the top four.
Year-to-Date Returns
What I'm watching. Oil is the biggest variable. If the Strait of Hormuz reopens, oil could pull back fast and HGER would likely feel it. If the conflict drags on, the disruption may only worsen.
Recession odds are rising. The February jobs report showed 92,000 jobs lost, and inflation is creeping higher alongside gas prices. The portfolio currently holds zero direct U.S. equity exposure, but if momentum shifts back toward U.S. stocks, the strategy will follow. That's what it's designed to do.
Up Next
The full March newsletter is coming next week with detailed performance data, risk metrics, and this month's deep dive. Thanks for reading.

Disclaimer & Disclosure
This newsletter is for informational purposes only and does not constitute financial advice, investment recommendations, or an offer to sell or buy any securities. The content is published as a journal of the author's personal investment activities and is intended for a general audience.
No Investment Advice: The author is not a financial advisor. You should not treat any opinion expressed herein as a specific inducement to make a particular investment or follow a particular strategy, but only as an expression of opinion.
Risk Warning: Investment involves risk, including the possible loss of principal. Past performance is not indicative of future results. No investment strategy or risk management technique can guarantee returns or eliminate risk in any market environment.
Data & Accuracy: Information contained herein has been obtained from sources believed to be reliable, but its accuracy and completeness are not guaranteed. All expressions of opinion are subject to change without notice in reaction to shifting market conditions.
Positions: The author currently holds positions in the securities mentioned in this newsletter. The author may buy or sell these securities at any time without notice.
Copyright: This content is provided solely for the personal use of the subscriber. Any unauthorized copying, forwarding, or distribution of this material is prohibited without prior written consent.