Chop, Not Catastrophe
The Asymmetric Edge strategy is up 21.5% year-to-date, more than double its 80/20 benchmark, even after a June pullback trimmed the lead. July holds the same four ETFs as June, with a rebalance that leans into commodities, plus a look at the tech selloff and a more hawkish Fed.


My July portfolio allocations are below. The same four ETFs that carried the portfolio through June carry it into July, the third month in a row for this lineup. The Asymmetric Edge strategy is up 21.5% year-to-date, more than double the 80/20 benchmark's 9.0%, and well ahead of the S&P 500, even after a choppy June. This issue is a quick look at how I am positioned for next month, plus a few notes on what moved the markets.
📌 This newsletter explains how I invest my own money, using a simple portfolio of four ETFs. The aim is to match a traditional balanced portfolio with shallower drawdowns. I share what I hold and why, so you can watch it play out.
June MTD: Asymmetric Edge −2.0% vs. 80/20 (AOA) −0.82%
YTD through 6/29: Asymmetric Edge +21.5% vs. 80/20 (AOA) +9.0%
YTD outperformance: +12.5 pp vs. 80/20, +12.3 pp vs. S&P 500
Portfolio Allocations for July
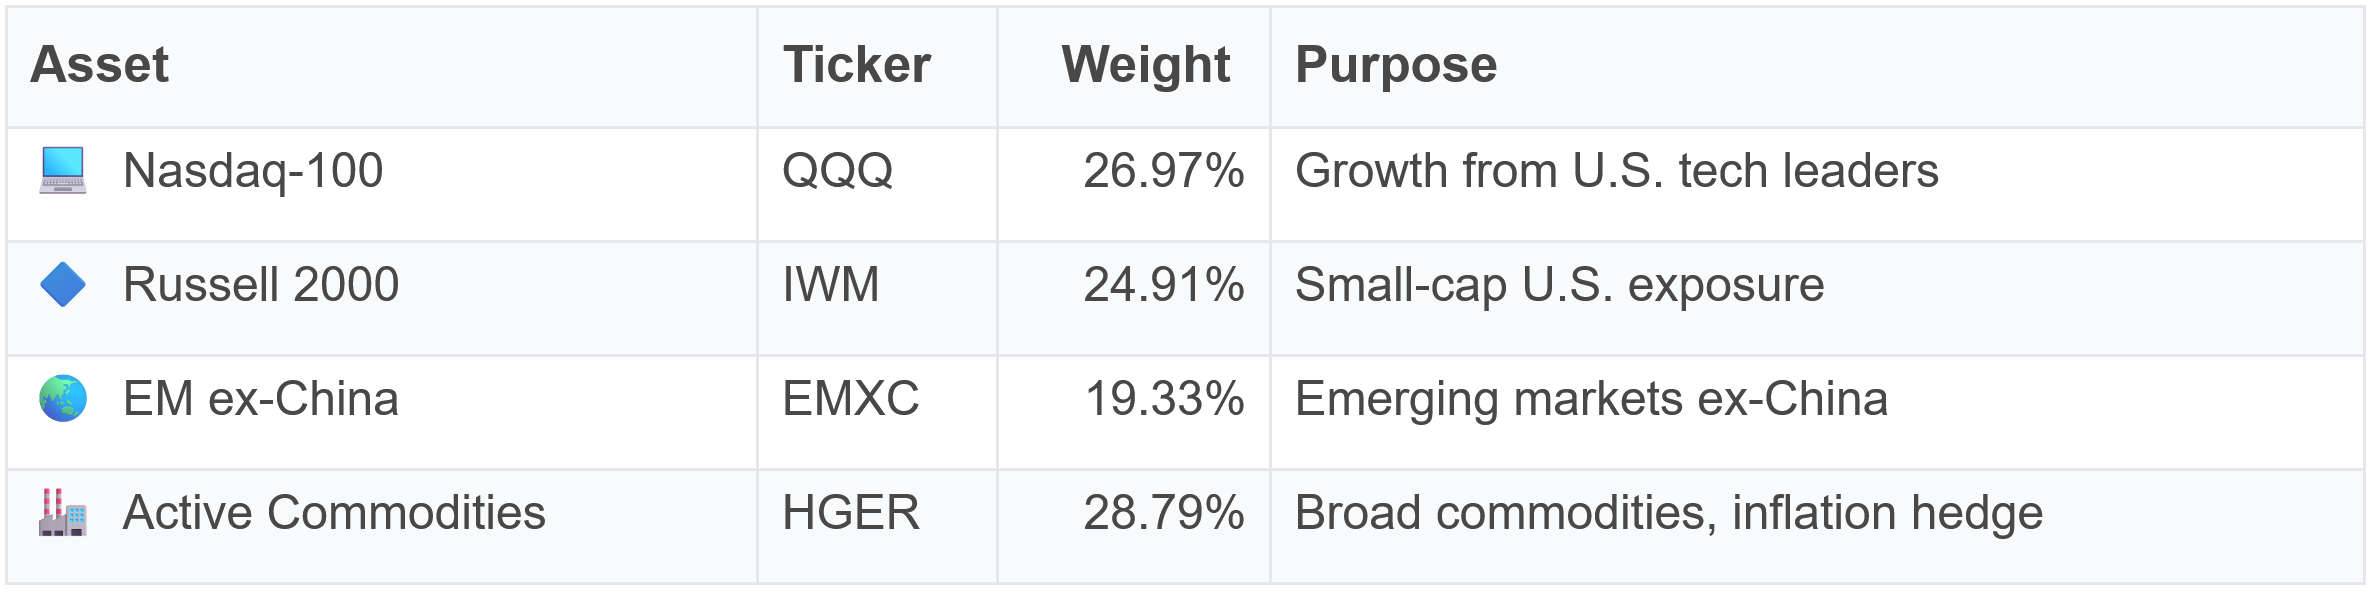
How Allocations Shifted from Last Month
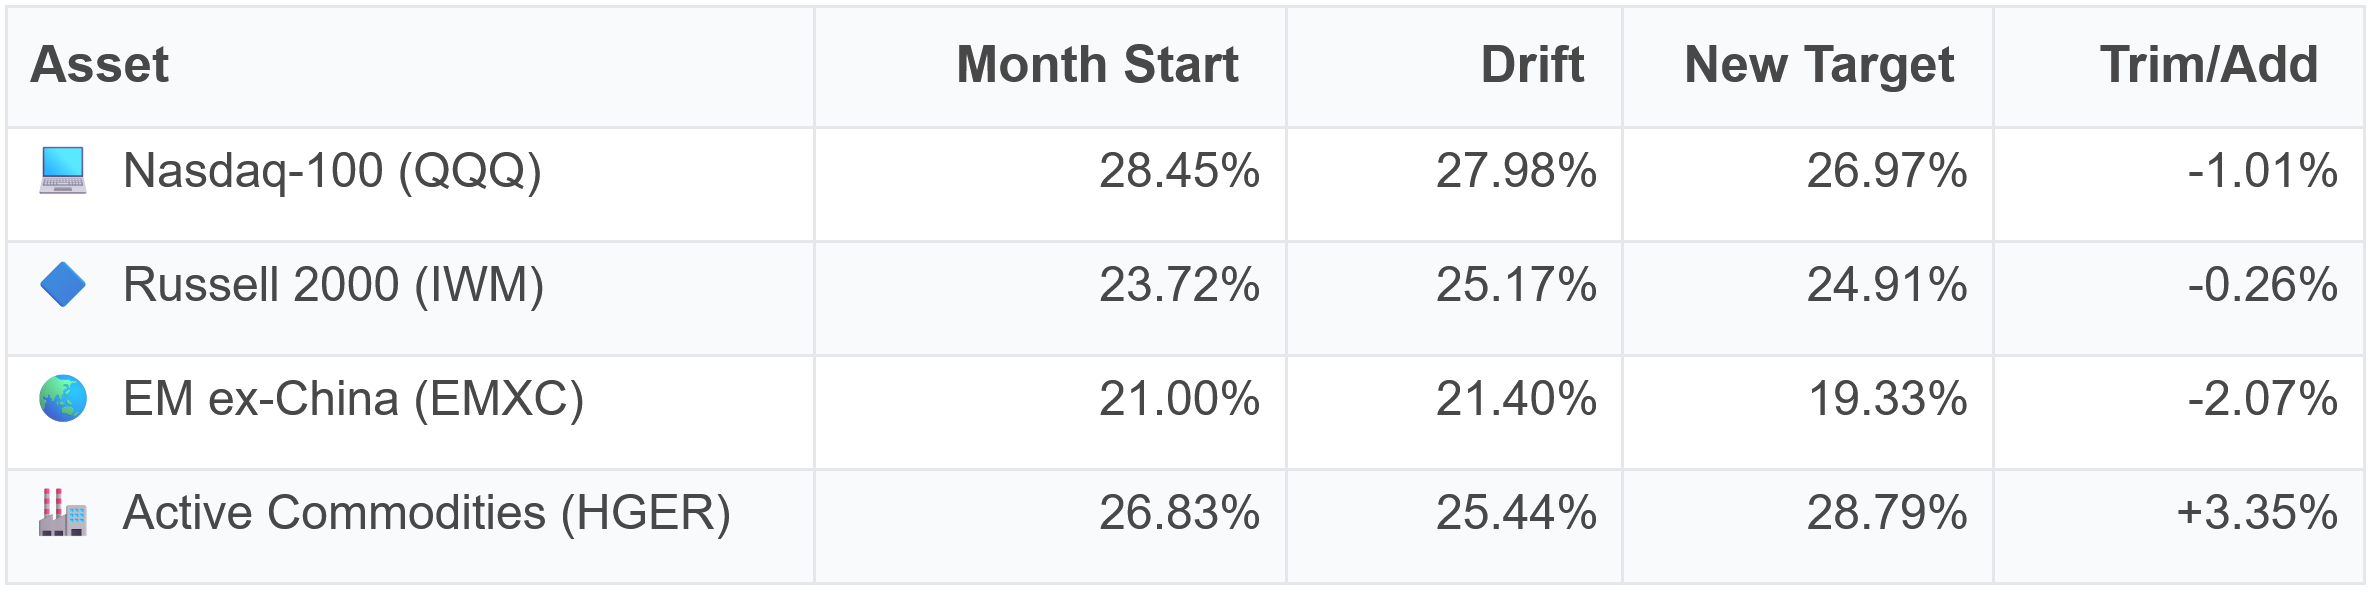
In the table above, the month start column is each position's weight at the June rebalance. The drift column is where each one landed by month-end from price movement alone. The new target is my model's recommended weight for July. The trim/add column is the actual trade, where a positive number means I added and a negative means I trimmed.
↗️ Active commodities topped up to a 28.79% target (+3.35%), the month's largest trade, after a weak June↘️ Emerging markets ex-China trimmed to 19.33% (−2.07%), the largest reduction↘️ Nasdaq-100 and Russell 2000 nudged down slightly to make room
No ETF entered or exited. July holds the same four as June, the third month in a row for this lineup. This was a rebalance, not a rotation.
The largest trade was topping up active commodities, the position that had the weakest month of the four. It fell about 8% in June and drifted down to 25.44%, and the model lifted it back to a 28.79% target. The reason it carries the largest weight is risk parity, where the model sizes each position so it contributes a similar amount of risk, and commodities have been the least volatile of the four holdings.
Emerging markets ex-China went the other way. It remains the top-ranked momentum asset, but its higher volatility caps how much weight my model can allocate to it, so it was trimmed the most, from 21.40% down to 19.33%. The Nasdaq-100 and Russell 2000 needed only small adjustments.

Quick Take
June was choppy, but the year-to-date lead held. The portfolio fell about 2% on the month while the S&P 500 fell about 1.7%. A mid-month selloff hit U.S. stocks hard, but the late-June bounce brought most of it back.
Much of the weakness traced back to one rough session. I wrote about that June 5 drop in What Six Selloffs Say About a Bad Friday. Nearly four weeks on, the equity positions I hold are flat to slightly higher than they were that day. June was choppy, but June 5th ended up not being the start of an immediate and extreme selloff.
Zoom out and the year-to-date gap is still the story. A hypothetical $10,000 invested at the start of the year would now be worth about $12,147 in the strategy versus $10,902 in the 80/20 benchmark and $10,924 in the S&P 500. The chart below shows the full spread against all the benchmarks I track.
Charting the Growth of $10,000
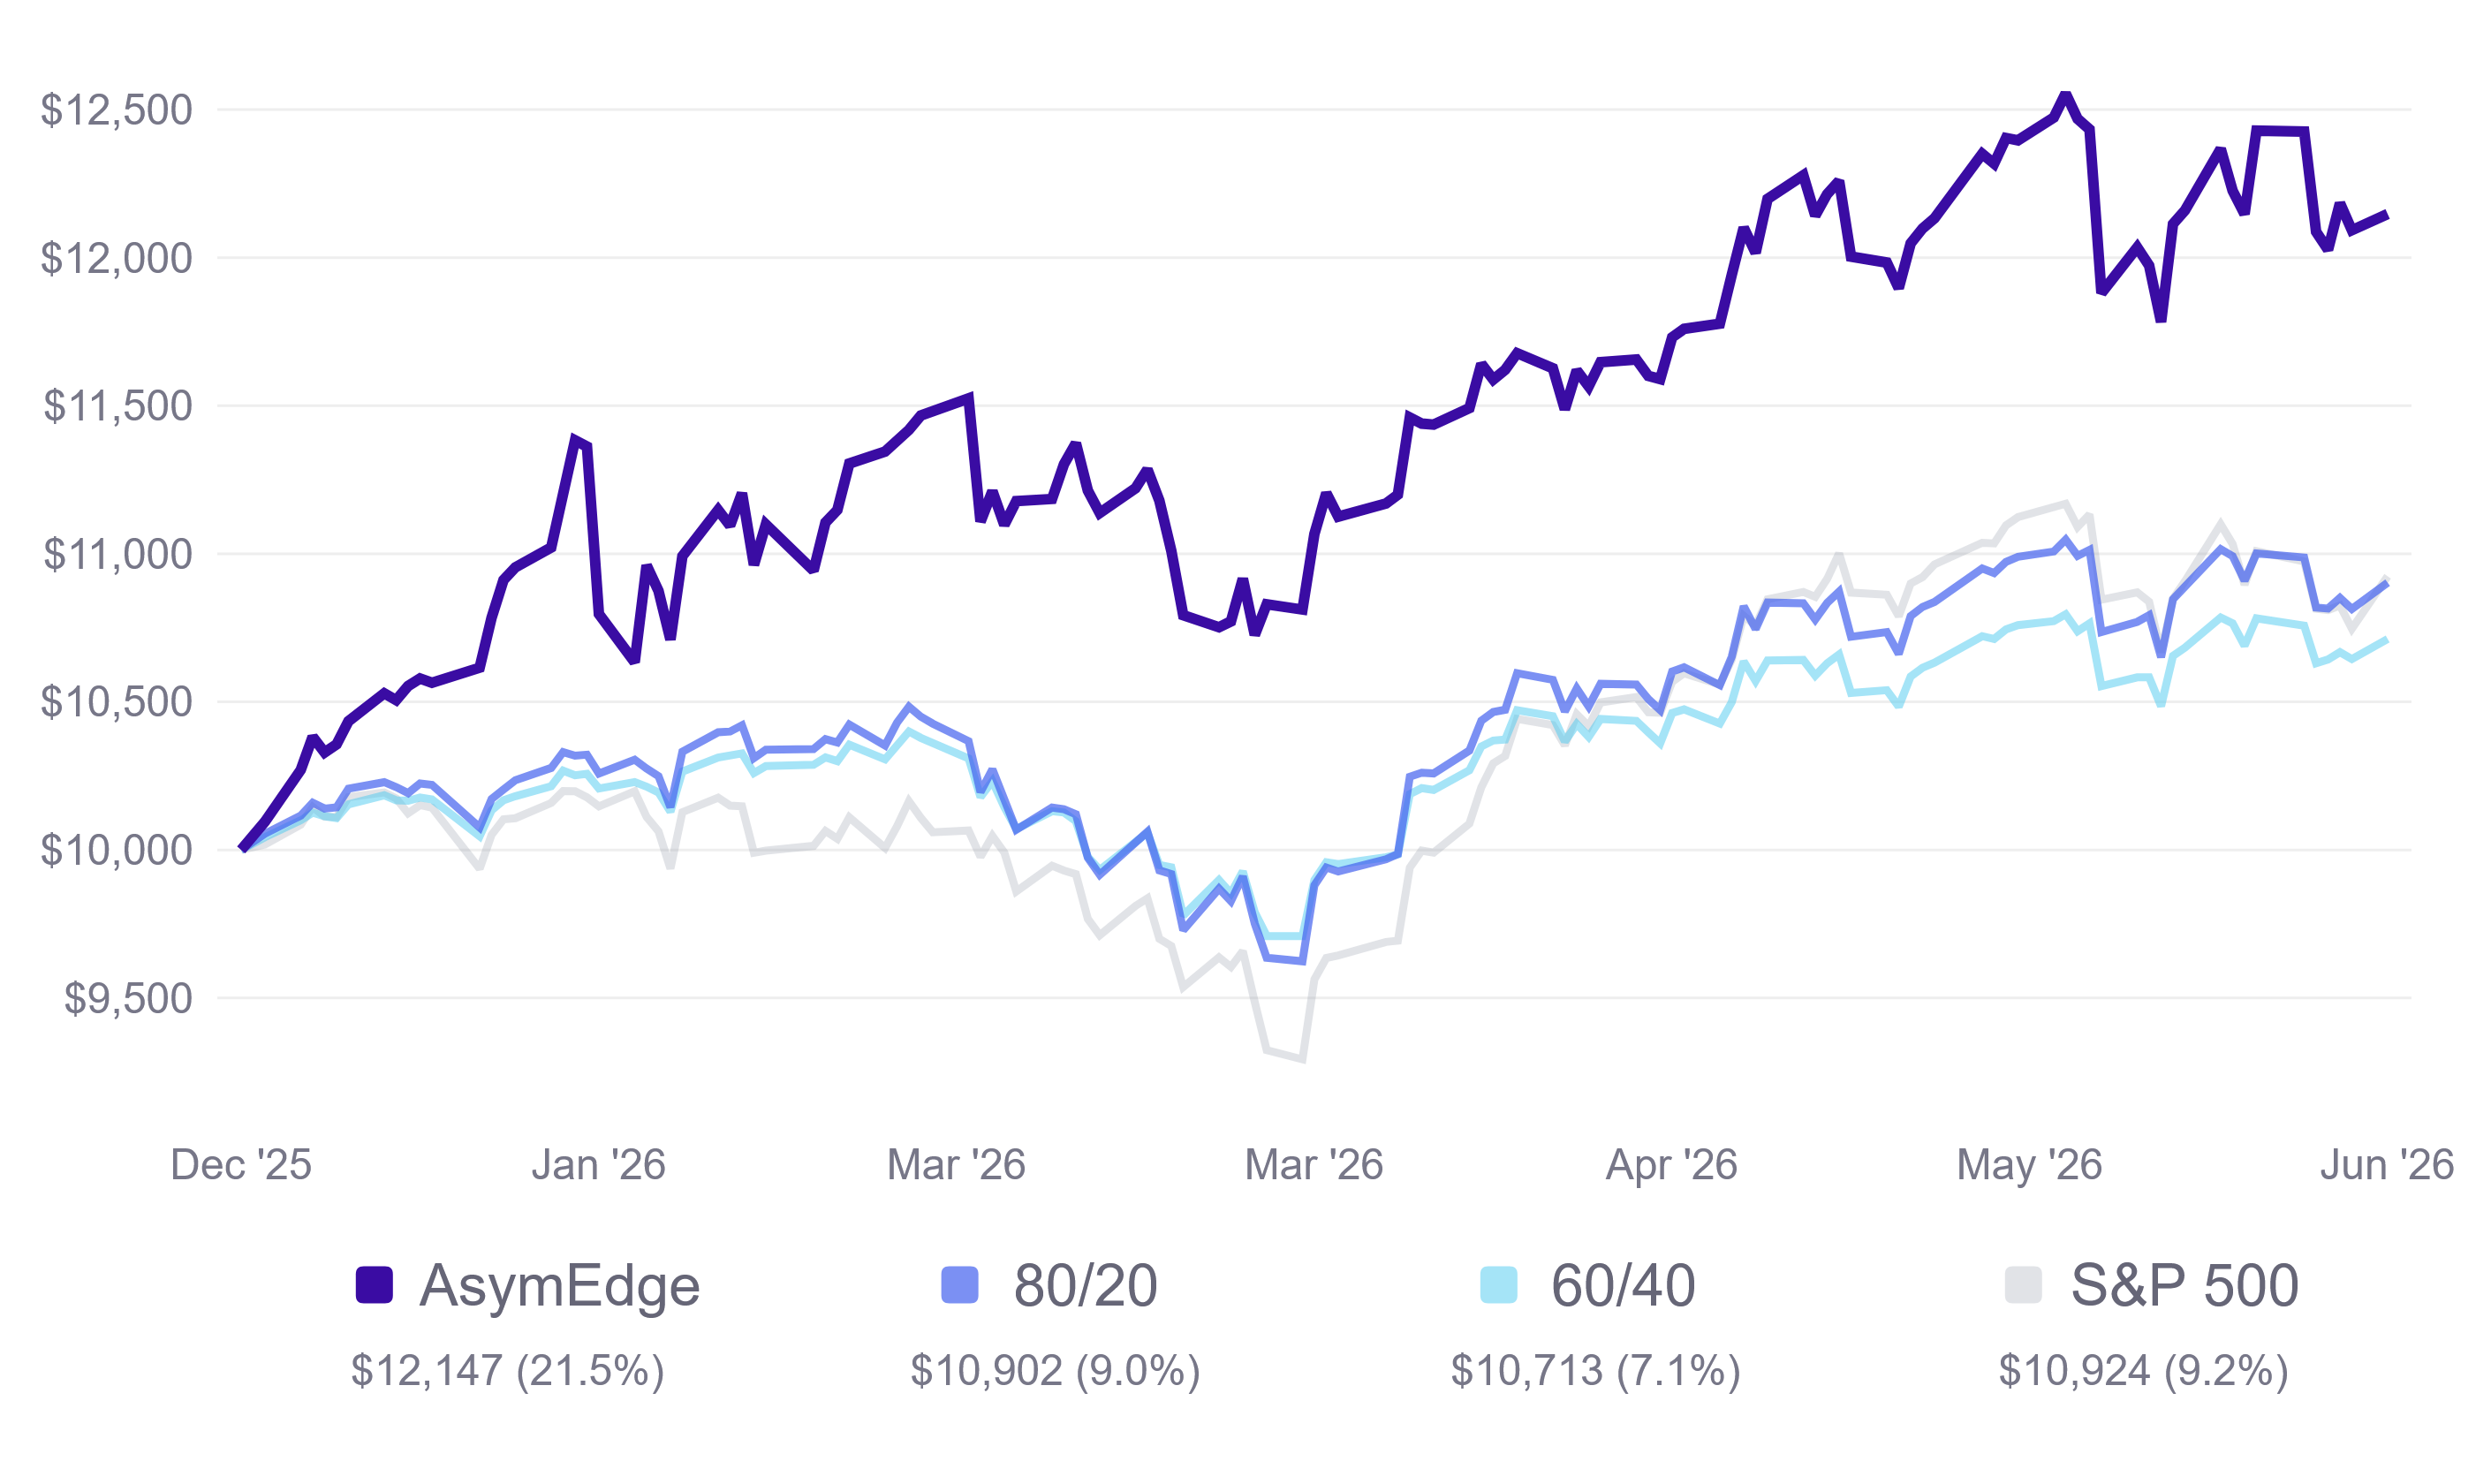
The strategy built its lead early in the year, gave some back during the late-March selloff, and slipped again in June, yet it has held a wide margin over every benchmark all year.
Year-to-Date Asset Class Returns
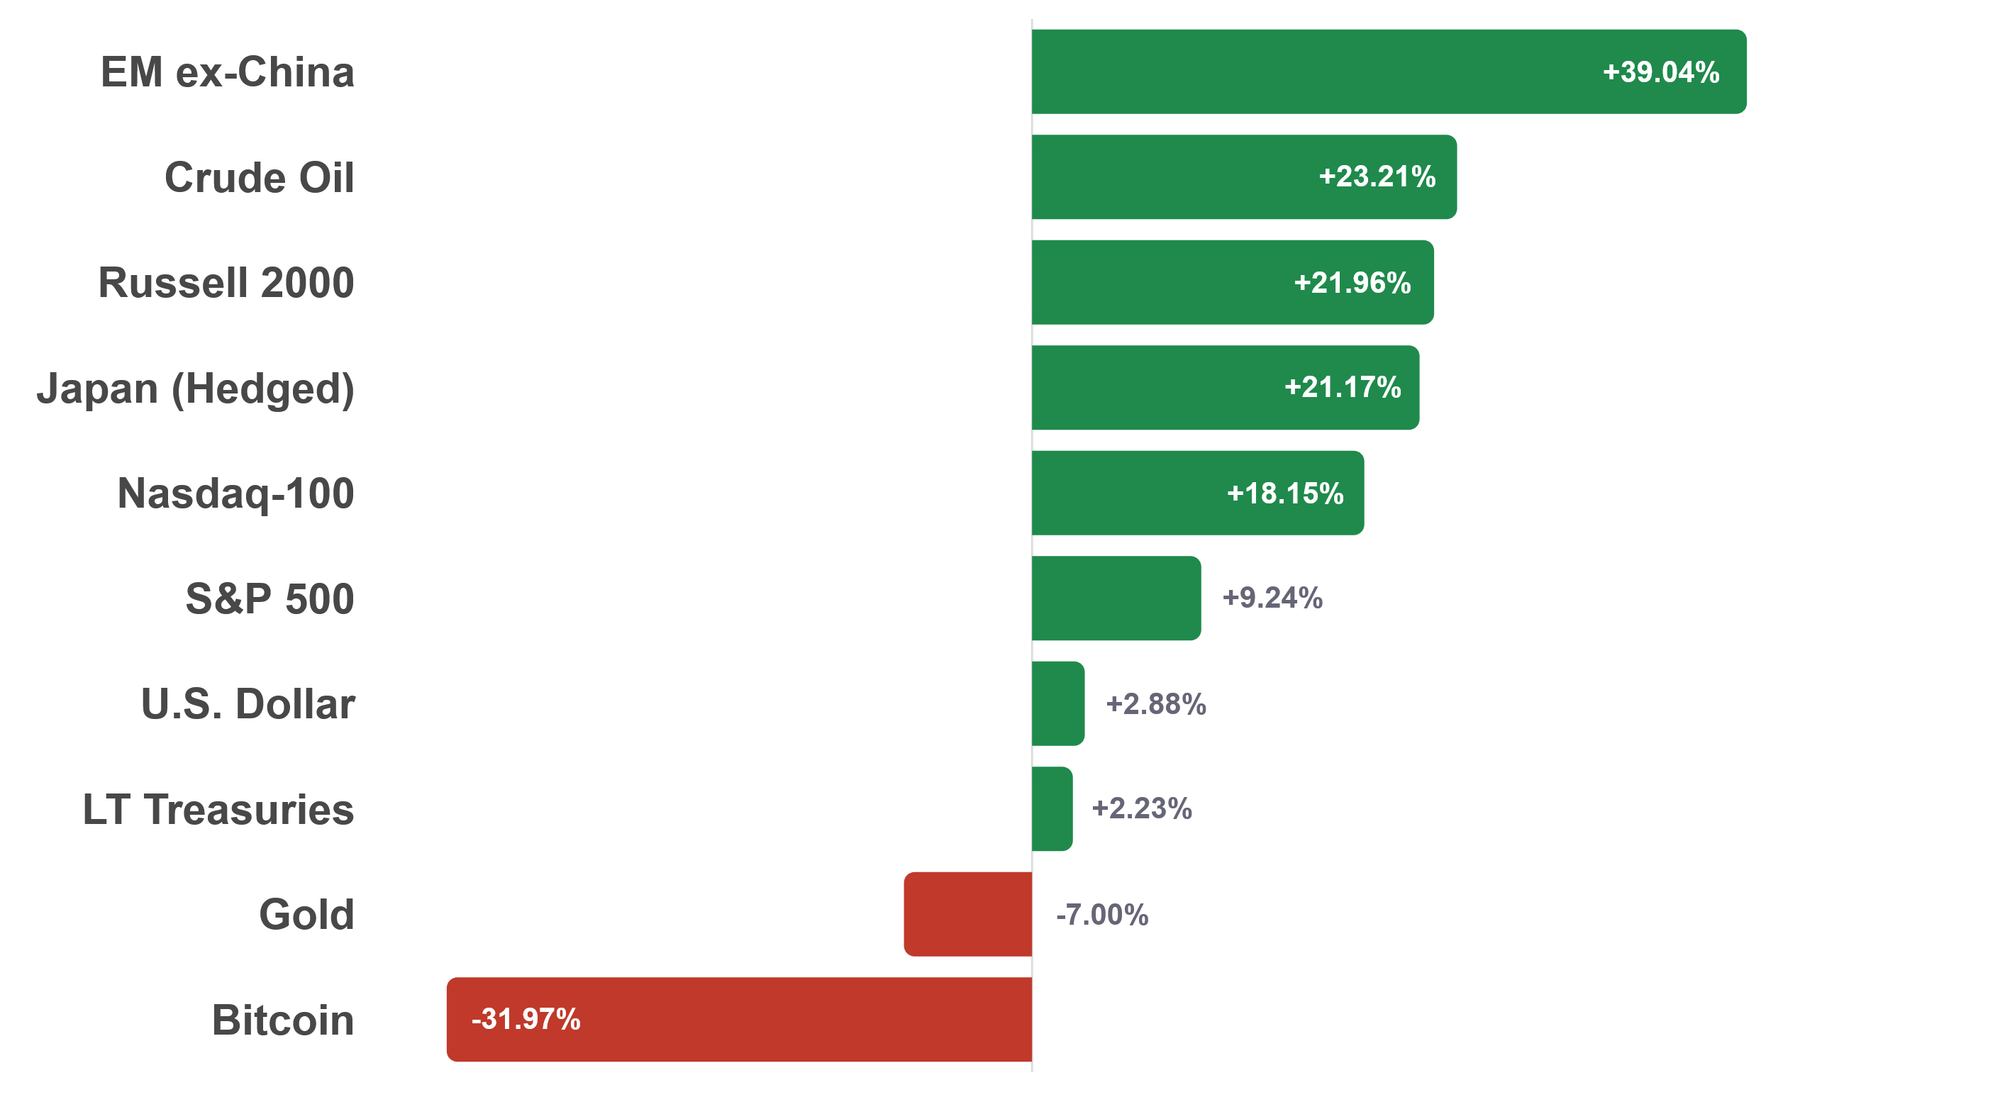
Emerging markets leads by a large margin, with crude oil, small caps, and Japan close behind. Gold and Bitcoin, which the strategy does not currently hold, are the year's clear laggards.
Brief Market Commentary
Tech led the pullback. After leading all year, the Nasdaq-100 sold off in early June as investors dumped semiconductor stocks, with one session wiping more than $1 trillion from chipmakers. Analysts called it a healthy reset after a stretched run, with a high bar for July earnings.
Emerging markets remained the year's standout. EM ex-China remains the strategy's top-ranked momentum asset and the best-performing slice of the universe, up about 39% year-to-date. The run is powered by the rotation out of China and by AI-driven chip demand in Taiwan and Korea.
The Fed turned more hawkish. May CPI rose to 4.2% year over year and core PCE (the Fed's preferred inflation measure) hit 3.4%, the highest since October 2023. At its June meeting the Warsh-led Fed held rates at 3.50% to 3.75%, took a rate cut off the table and signaled a hike is possible.
Small caps were the lone bright spot. The Russell 2000 rose about 4% in June, the only one of the four portfolio holdings to gain ground while tech and commodities fell. Small caps holding firm even as the Fed leaned more hawkish was a notable bit of resilience in an otherwise soft month.
What I'm Watching
The Fed is the biggest swing factor. With a rate cut off the table and a hike now on it, a hawkish surprise would likely hit small caps and the Nasdaq hardest, two of the portfolio's largest positions. Inflation's path matters just as much, since another energy-driven print could keep the Fed leaning hawkish.
The tech trade is also worth watching after a sharp June reset and ahead of July earnings. If any of these flips the momentum picture, the strategy would become more defensively positioned. That is the whole point of following the data instead of the headlines.
Up Next
The full July newsletter is coming in the next week or two with detailed performance data, risk metrics, and July's deep dive. Thanks for reading.


Disclaimer & Disclosure
This newsletter is for informational purposes only and does not constitute financial advice, investment recommendations, or an offer to sell or buy any securities. The content is published as a journal of the author's personal investment activities and is intended for a general audience.
No Investment Advice: The author is not a financial advisor. You should not treat any opinion expressed herein as a specific inducement to make a particular investment or follow a particular strategy, but only as an expression of opinion.
Risk Warning: Investment involves risk, including the possible loss of principal. Past performance is not indicative of future results. No investment strategy or risk management technique can guarantee returns or eliminate risk in any market environment.
Data & Accuracy: Information contained herein has been obtained from sources believed to be reliable, but its accuracy and completeness are not guaranteed. All expressions of opinion are subject to change without notice in reaction to shifting market conditions.
Positions: The author currently holds positions in the securities mentioned in this newsletter. The author may buy or sell these securities at any time without notice.
Copyright: This content is provided solely for the personal use of the subscriber. Any unauthorized copying, forwarding, or distribution of this material is prohibited without prior written consent.