The Year's Best Stock Fund Just Left the Portfolio
The Asymmetric Edge strategy is up 20.7% year-to-date, more than double the 80/20 benchmark's 8.8%. Emerging markets ex-China is up 26.20% this year and just fell out of the portfolio. Japan hedged equity takes its place, and cash came closer to entering than it has all year.


My August portfolio allocations are below. Emerging markets ex-China is up 26.20% this year, the best of the stock funds I track, and it is not in the portfolio for August. Japan hedged equity takes its place. The strategy is up 20.7% year-to-date against 8.8% for the 80/20 benchmark. This issue covers how I am positioned for next month, what caused the swap, and how close the portfolio came to exiting into cash.
📌 This newsletter explains how I invest my own money, using a simple portfolio of four ETFs. The aim is to match a traditional balanced portfolio with shallower drawdowns. I share what I hold and why, so you can watch it play out.
July MTD: Asymmetric Edge −1.9% vs. 80/20 (AOA) −0.5%
YTD through 7/30: Asymmetric Edge +20.7% vs. 80/20 (AOA) +8.8%
YTD outperformance: +11.9 pp vs. 80/20, +11.4 pp vs. S&P 500
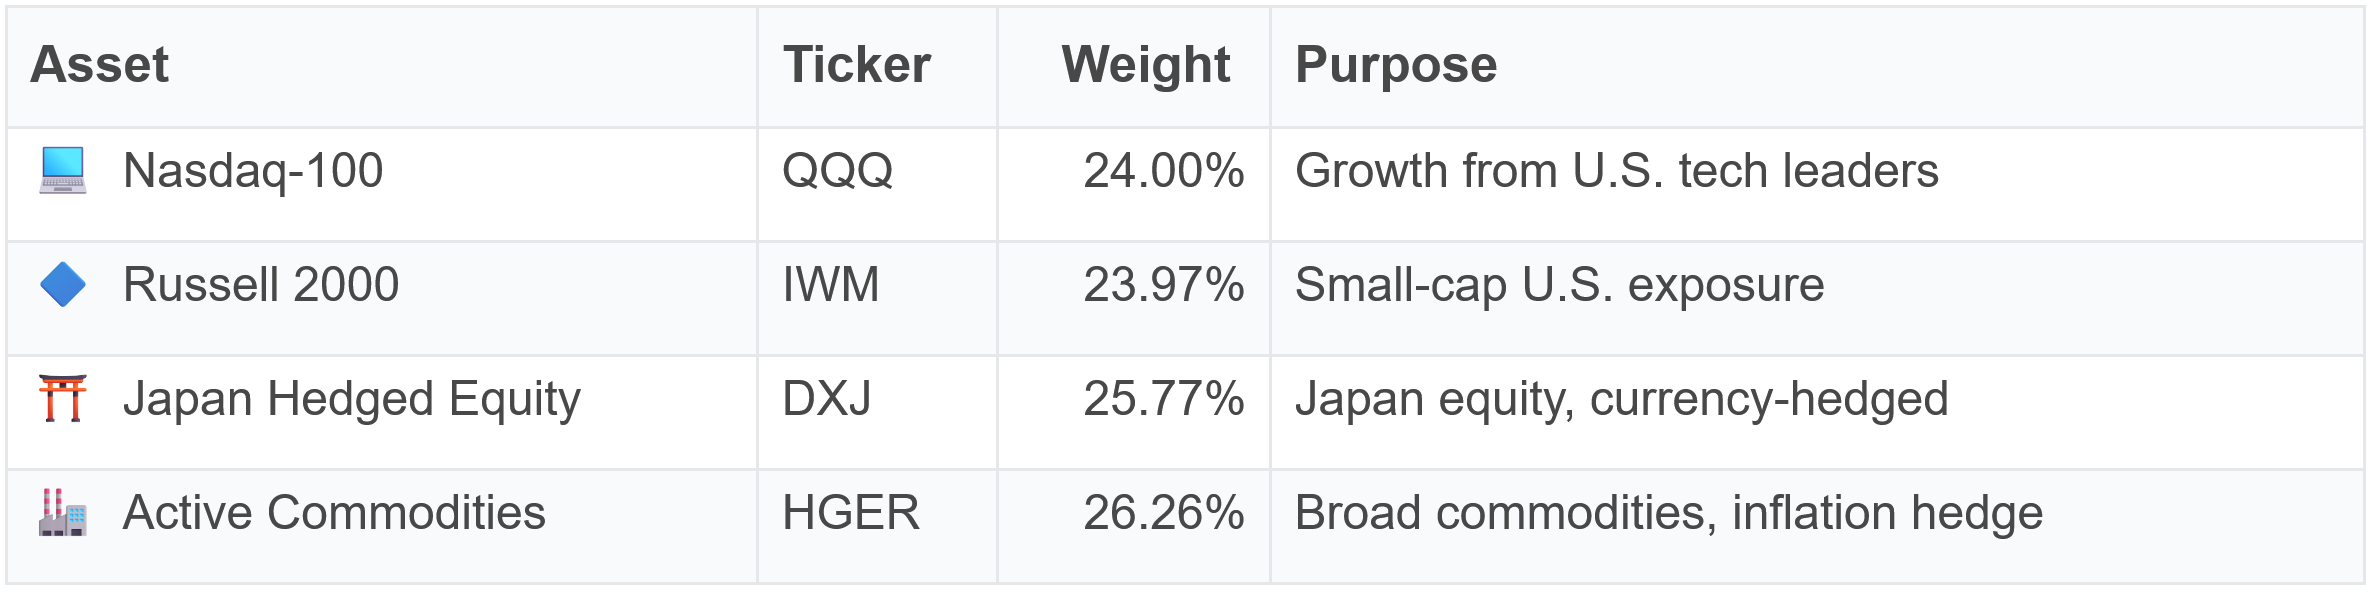
Portfolio Allocations for August
How Allocations Shifted from Last Month
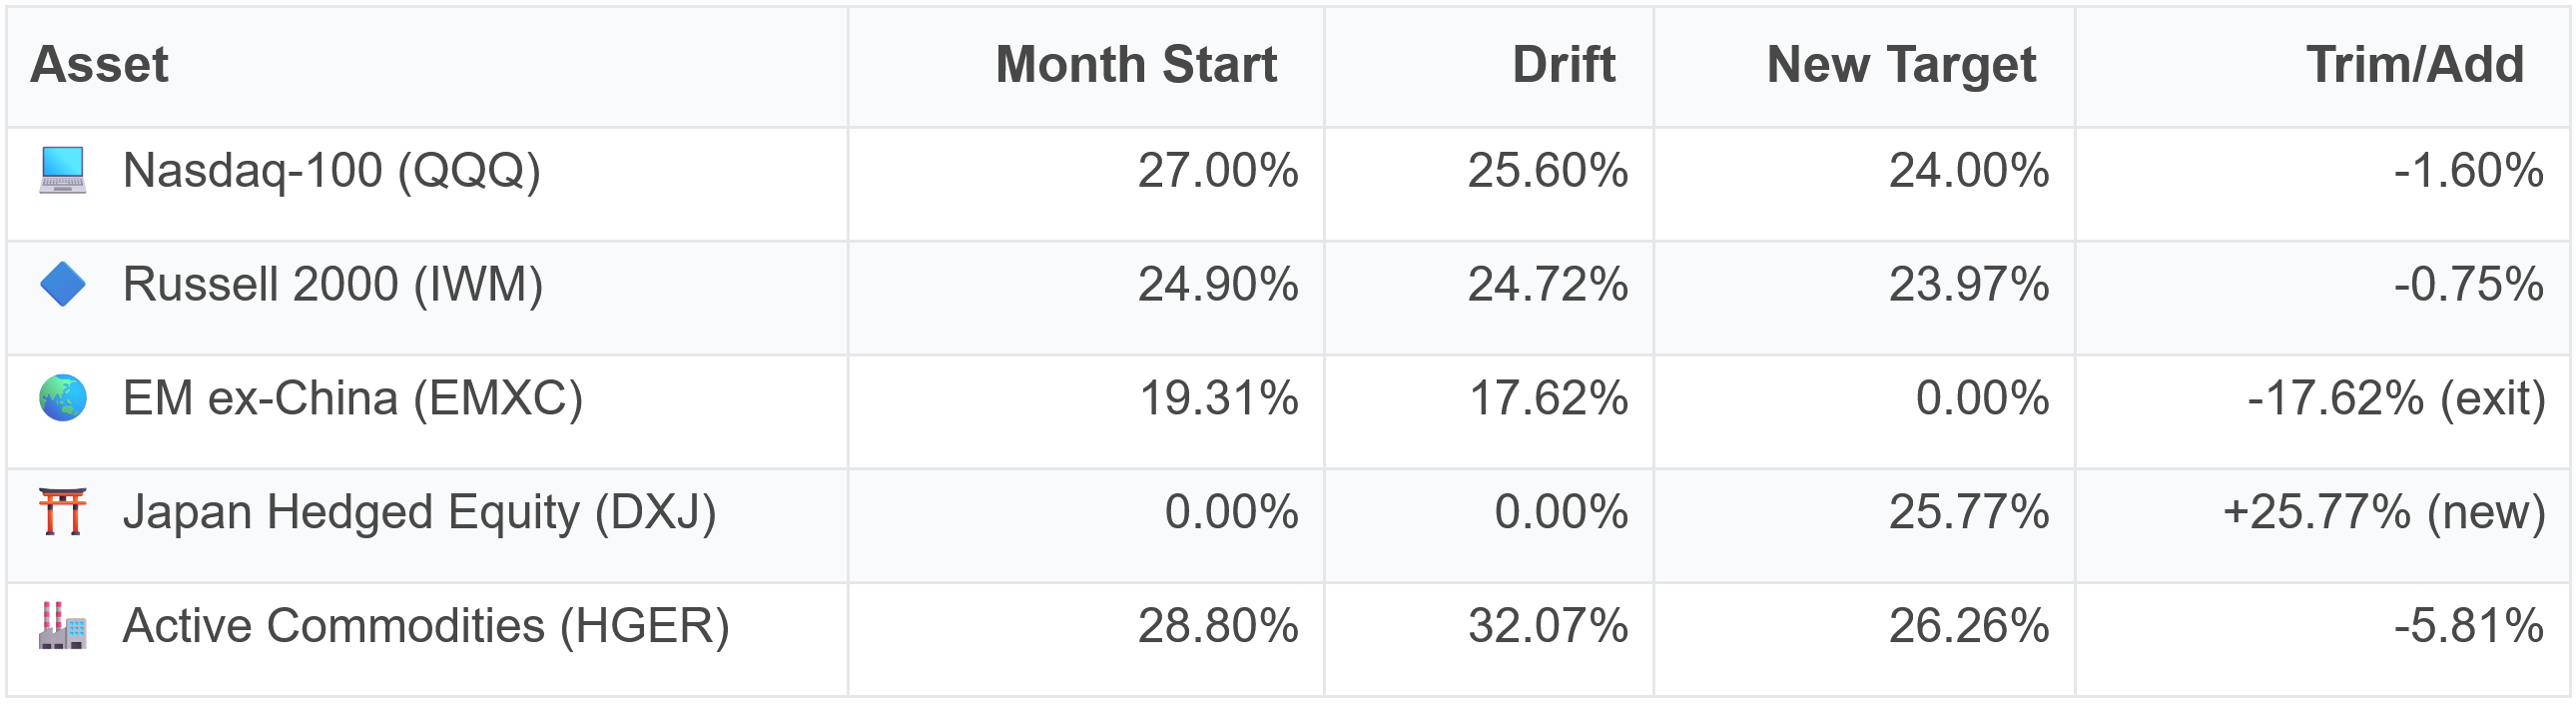
📤 Emerging markets ex-China exits after falling 10.87% in July, the worst month of the four
⚖️ Active commodities trimmed from a 32.07% drift back to a 26.26% target, the largest trade of the month
⚖️ Nasdaq-100 and Russell 2000 nudged down by less than two points each
Commodities got trimmed because of risk parity, where the model sizes each position on how volatile it is rather than how well it has done. Active commodities has been the steadiest of the four, which is why it still holds the largest weight. It rose 9.58% in July and drifted up to 32.07% on price alone, so the model pulled it back to target. That target is a little below last month's because Japan is far less volatile than emerging markets was, so it takes a bigger share of the portfolio.
Japan hedged equity (DXJ) buys Japanese companies while hedging out the yen, so a U.S. investor collects the stock returns without the currency drag. It takes the second-largest weight because its volatility sits between commodities and the two U.S. equity positions, and risk parity sizes it accordingly.

Just Outside the Top Four
Two names are worth flagging this month, and the second is the more interesting of the pair.
The first is emerging markets ex-China (EMXC). This ETF actually ranked third overall, but did not make it into the portfolio because my model picks its three equity positions first using a shorter momentum window, then ranks the survivors against commodities, bonds, gold, and cash.
Emerging markets finished fourth out of the four available equity ETFs in my strategy basket on that shorter window and was dropped before the main ranking ever ran.
The second is short-term Treasuries (BIL), which is effectively cash. It was the next name in line after the top four, trailing the Nasdaq-100 by roughly half a percentage point of blended momentum, my model's single score combining an asset's recent and longer-run price trends.
That near-miss matters more than a fifth-place finish normally would. Cash carries almost no volatility, so risk parity would have sized it enormously. Had it edged out the Nasdaq-100, the model would have put roughly 95% of the portfolio into short-term Treasury bills and left the other three positions with tiny allocations. The strategy came within half a percentage point of going almost entirely defensive.
It did not happen, and one month's ranking is not a forecast. But it is a clear window into how the system behaves as equity momentum erodes, and it is the closest the portfolio has come to a defensive posture this year.
Quick Take
July was a losing month that ended with a surge higher on the 30th. Over the month the strategy fell 1.9% while the S&P 500 fell 0.7% and the 80/20 benchmark fell 0.5%. Most of the damage came from AI-related selling that hit Asia hardest.
Zoom out and the year still looks great. A hypothetical $10,000 invested at the start of the year would be worth about $12,072 in the strategy versus $10,934 in the S&P 500. The chart below shows the spread against the balanced benchmarks.
Charting the Growth of $10,000
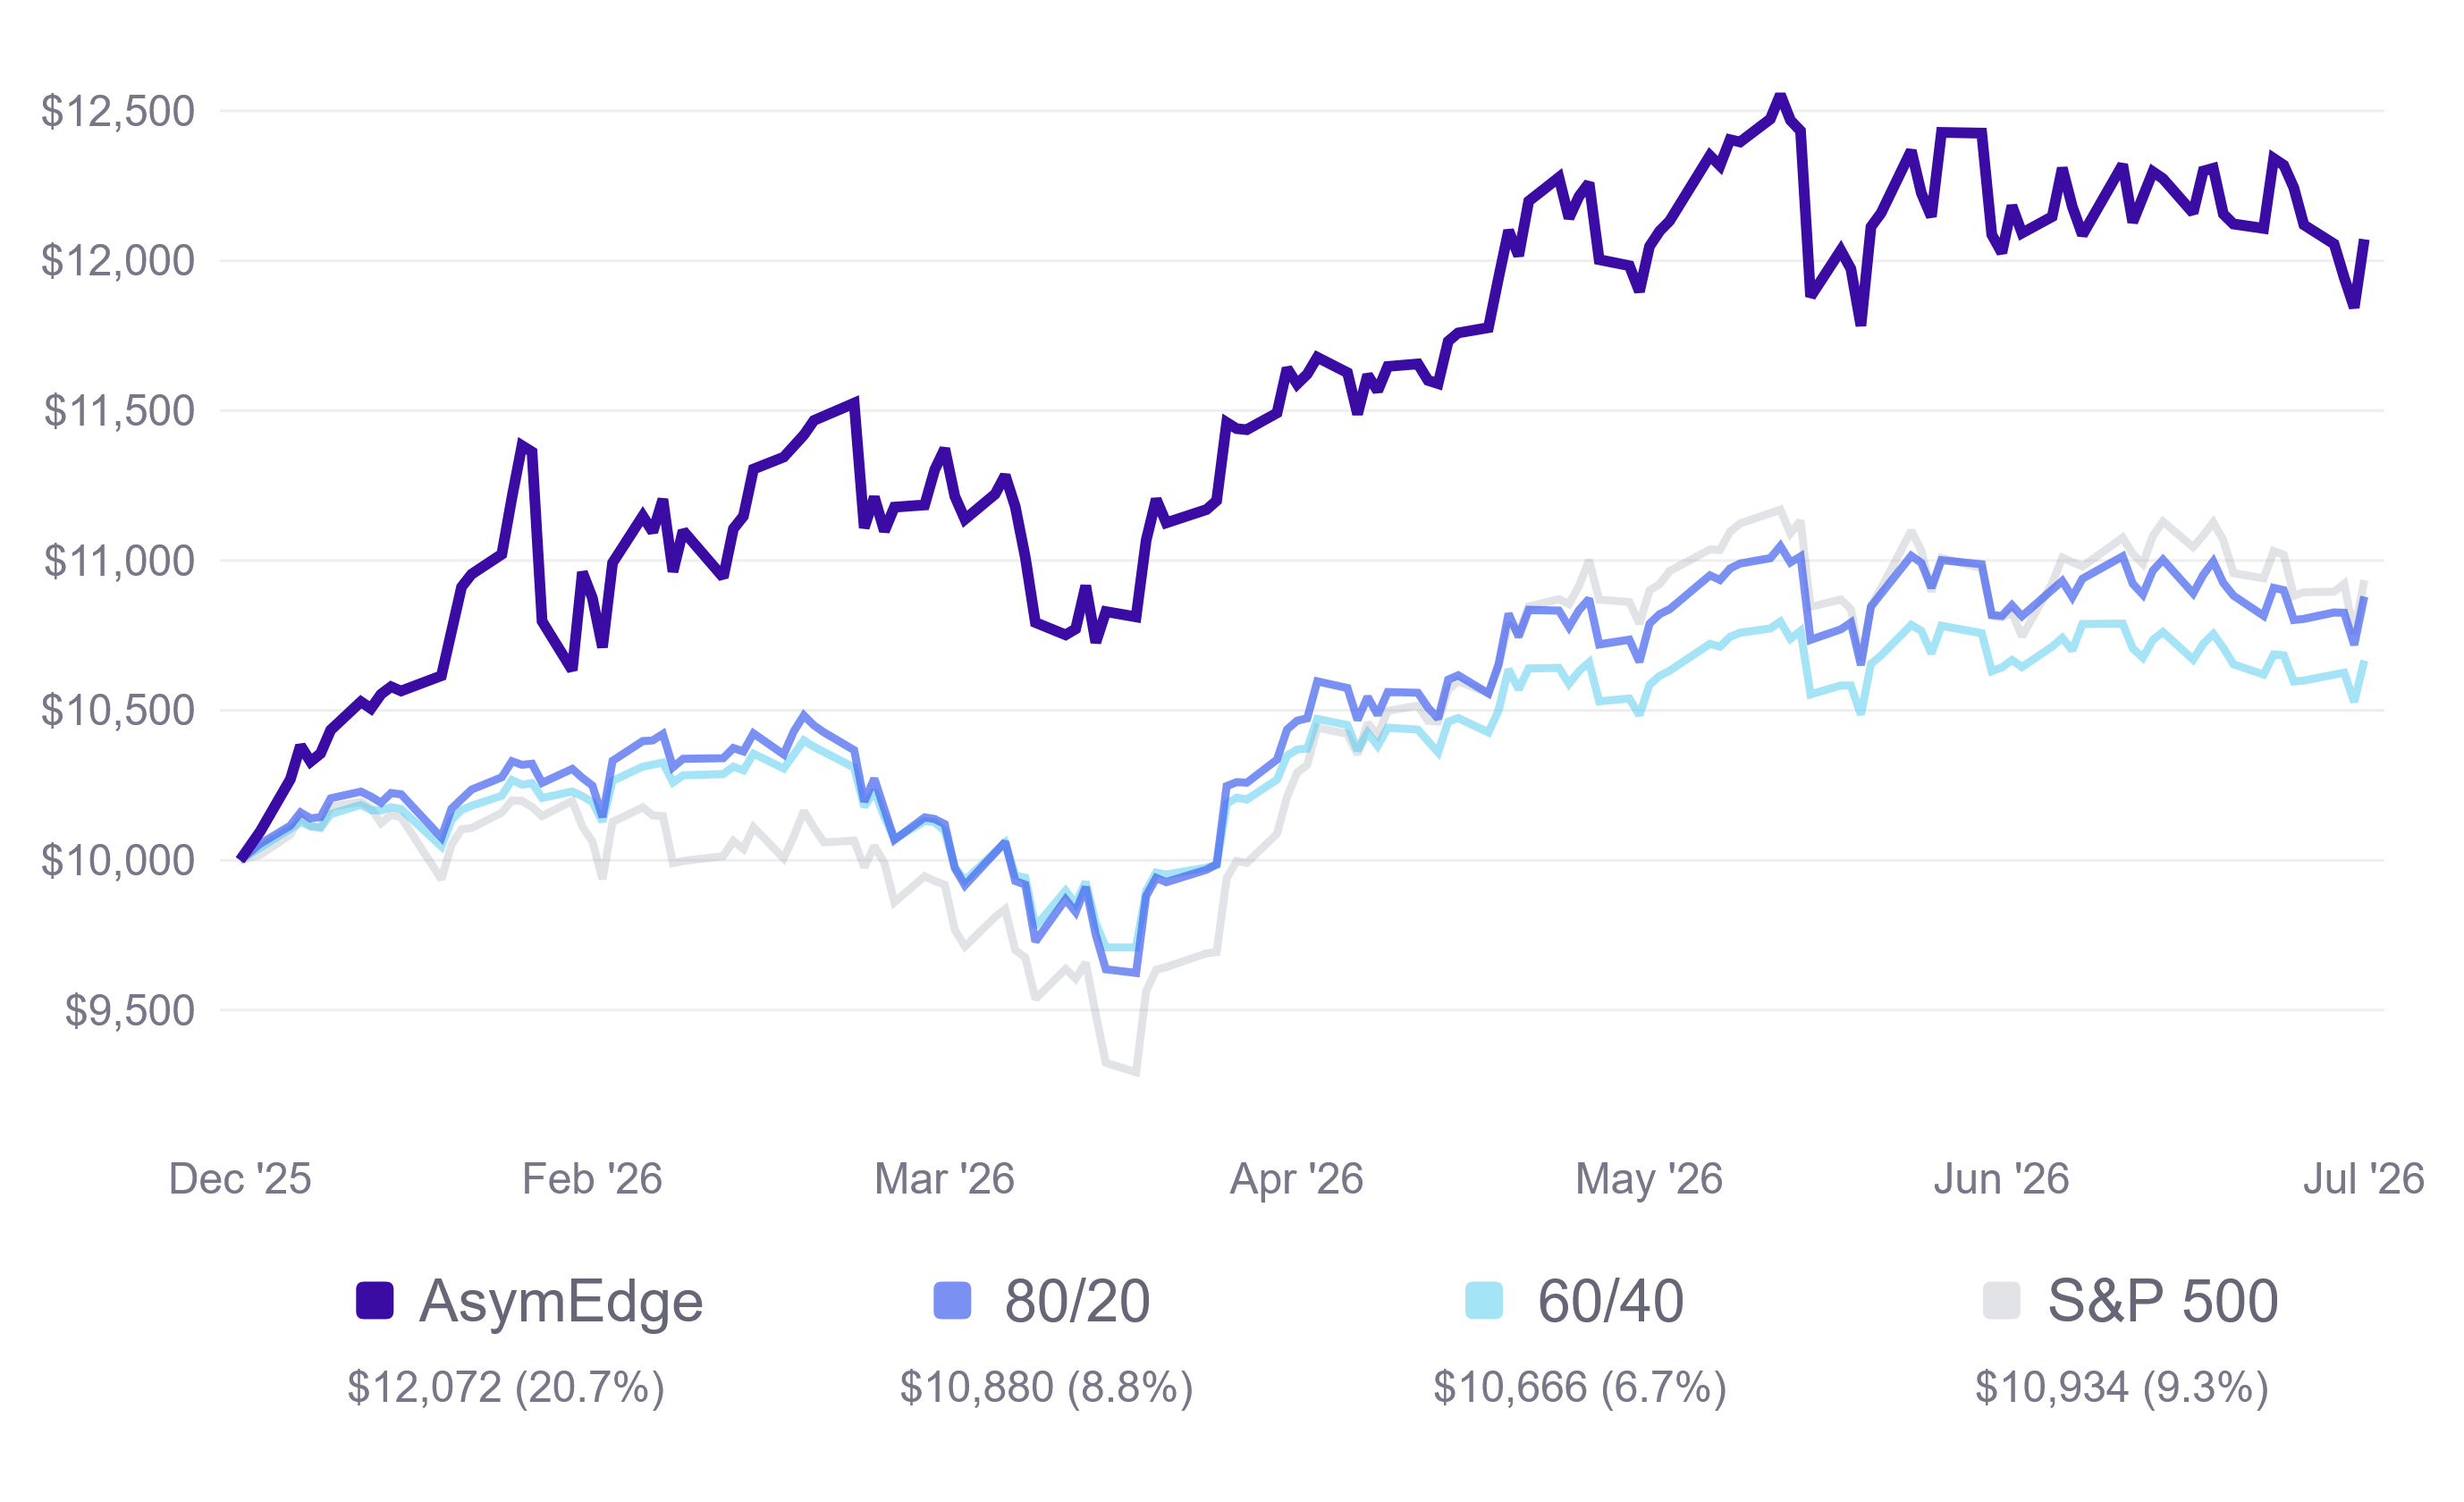
The strategy built its lead in the first half of the year, gave some back in the late-March selloff, and has traded sideways since May while holding a wide margin over every benchmark.
Portfolio and Benchmark Returns
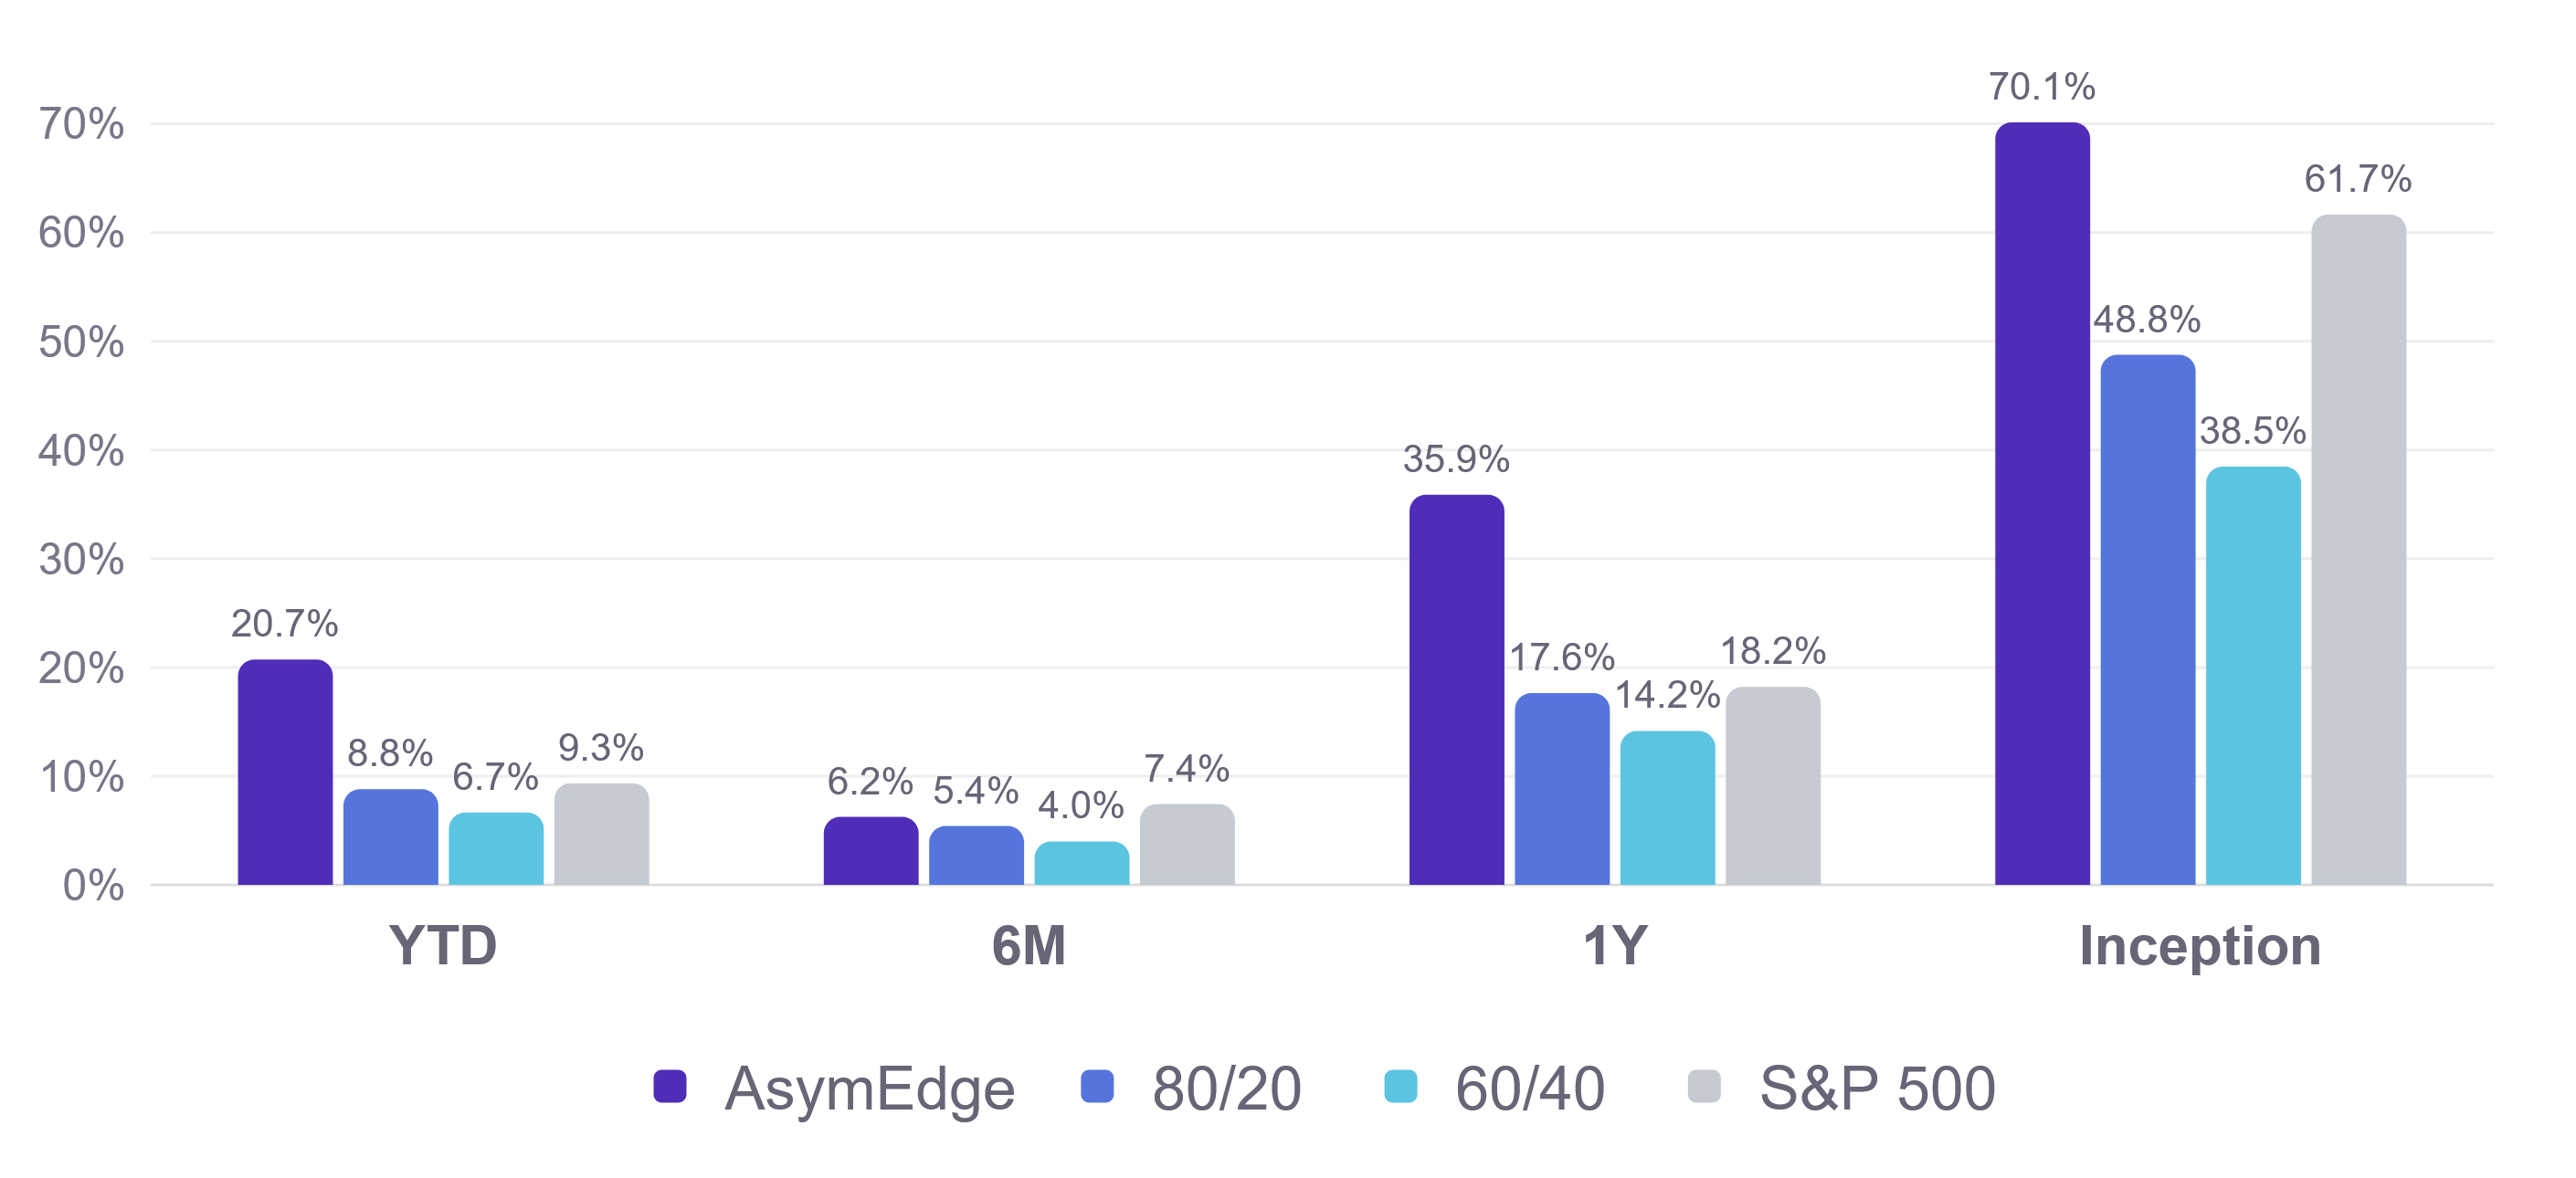
The 80/20 benchmark is the one I primarily measure my performance against, and the strategy is ahead of it on every window in this chart. The margin is narrow over six months, 6.2% against 5.4%, and it widens considerably over twelve. The S&P 500 outperformed my strategy over the last six months, 7.4% against 6.2%.
Year-to-Date Asset Class Returns
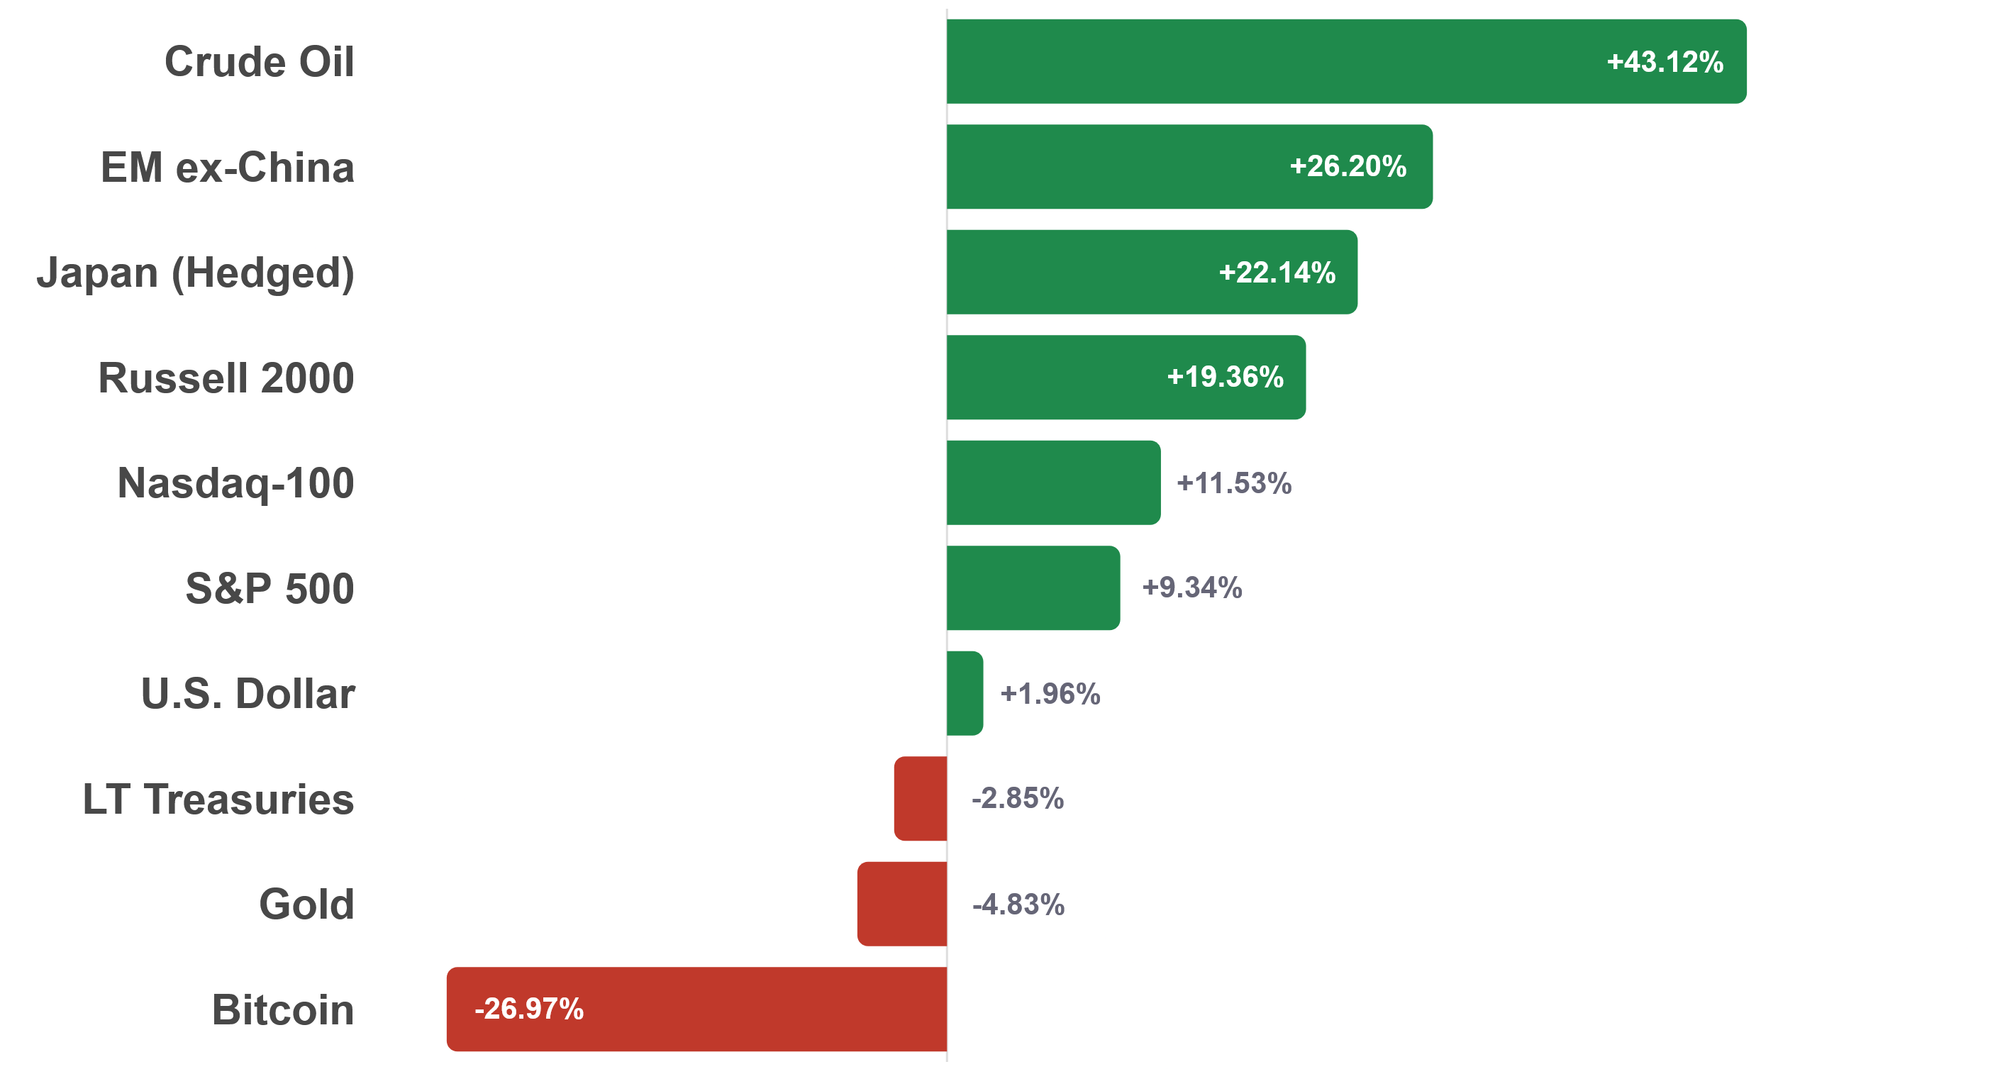
Emerging markets ex-China is second on this chart at 26.20%, and I sold all of it. The year-to-date number is not what my model reads. The screen that dropped it looks at the last few months, and over that stretch emerging markets fell 10.87% while Japan was roughly flat.
Brief Market Commentary
Asian tech crashed and took emerging markets with it. South Korea's Kospi fell 10.7% on July 28, its eighth circuit breaker of 2026, and Taiwan's TAIEX posted its third-largest point decline on record. The Kospi ended July down 28.9%, a worse month than October 2008.
The rotation that followed. Korea logged $30.5 billion of equity outflows in a single month, its worst in more than 25 years. Emerging markets ex-China fell 10.87% and leaves the portfolio. Japan hedged equity, roughly flat over the same window, takes its place and is up 22.14% this year.
Oil had its best month in more than two years. Iran's ceasefire collapsed, Houthi militants struck a Saudi tanker in the Red Sea, and Brent crude rose 7.3% on July 29 alone to above $88. Crude is up 43.12% this year and active commodities (HGER) is my largest position.
A brutal Wednesday, then a violent Thursday. July 29 was the Dow's worst session since April, down 1,153 points. July 30 took most of it back, with the Nasdaq up about 2.4% and Microsoft gaining about 16% on cloud earnings, its best day since 2008.
What I'm Watching
The Fed is the variable that matters most. Three officials dissented in favor of a hike on July 29, the most unified hawkish dissent since 2016, and markets closed the session pricing roughly 80% odds of an increase in September. A hike would land hardest on the Nasdaq-100 and small caps, which together are about half my portfolio.
I am also watching cash. Short-term Treasuries sat half a percentage point outside the top four this month. If equity momentum keeps eroding, the strategy could become considerably more defensively positioned.
Up Next
The full August newsletter is coming mid-month with detailed performance data, risk metrics, and this month's deep dive. Thanks for reading.

Disclaimer & Disclosure
This newsletter is for informational purposes only and does not constitute financial advice, investment recommendations, or an offer to sell or buy any securities. The content is published as a journal of the author's personal investment activities and is intended for a general audience.
No Investment Advice: The author is not a financial advisor. You should not treat any opinion expressed herein as a specific inducement to make a particular investment or follow a particular strategy, but only as an expression of opinion.
Risk Warning: Investment involves risk, including the possible loss of principal. Past performance is not indicative of future results. No investment strategy or risk management technique can guarantee returns or eliminate risk in any market environment.
Data & Accuracy: Information contained herein has been obtained from sources believed to be reliable, but its accuracy and completeness are not guaranteed. All expressions of opinion are subject to change without notice in reaction to shifting market conditions.
Positions: The author currently holds positions in the securities mentioned in this newsletter. The author may buy or sell these securities at any time without notice.
Copyright: This content is provided solely for the personal use of the subscriber. Any unauthorized copying, forwarding, or distribution of this material is prohibited without prior written consent.