Bitcoin Returns in My Biggest Rotation of the Year
Bitcoin returns to the portfolio today after nine months out, in the largest rotation of my year. Both U.S. equity positions leave. The Asymmetric Edge strategy is up 26.69% year-to-date against 11.80% for the 80/20 benchmark.


My September portfolio allocations are below. Today's rebalance, Monday, August 31, is the largest of the year. Half the portfolio turns over, both U.S. equity positions exit, and Bitcoin returns after nine months out.
The strategy is up 26.69% year-to-date against 11.80% for the 80/20 benchmark. This issue covers how I am positioned for September, and why a month of record highs in U.S. stocks was still not enough to keep them in my strategy’s top four rankings.
📌 This newsletter explains how I invest my own money, using a simple portfolio of four ETFs. The aim is to match a traditional balanced portfolio with shallower drawdowns. I share what I hold and why, so you can watch it play out.
August MTD: Asymmetric Edge +4.64% vs. 80/20 (AOA) +2.45%, S&P 500 +2.99%
YTD: Asymmetric Edge +26.69% vs. 80/20 (AOA) +11.80%, S&P 500 +13.42%
YTD outperformance: +14.9 pp vs. 80/20, +13.3 pp vs. S&P 500
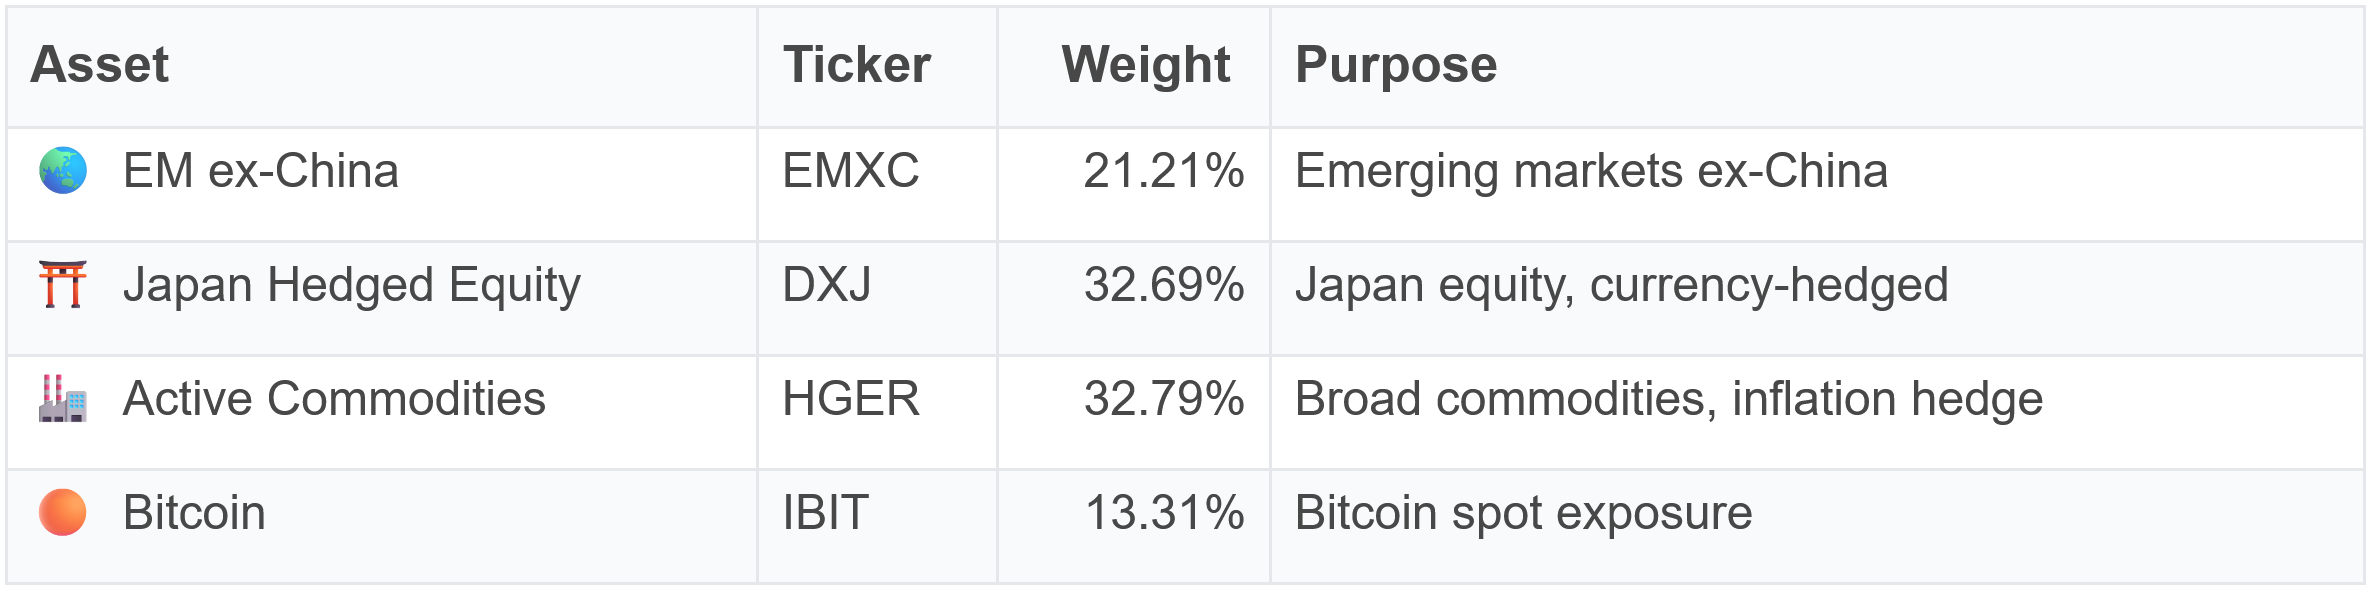
Portfolio Allocations for September
How Allocations Shifted from Last Month
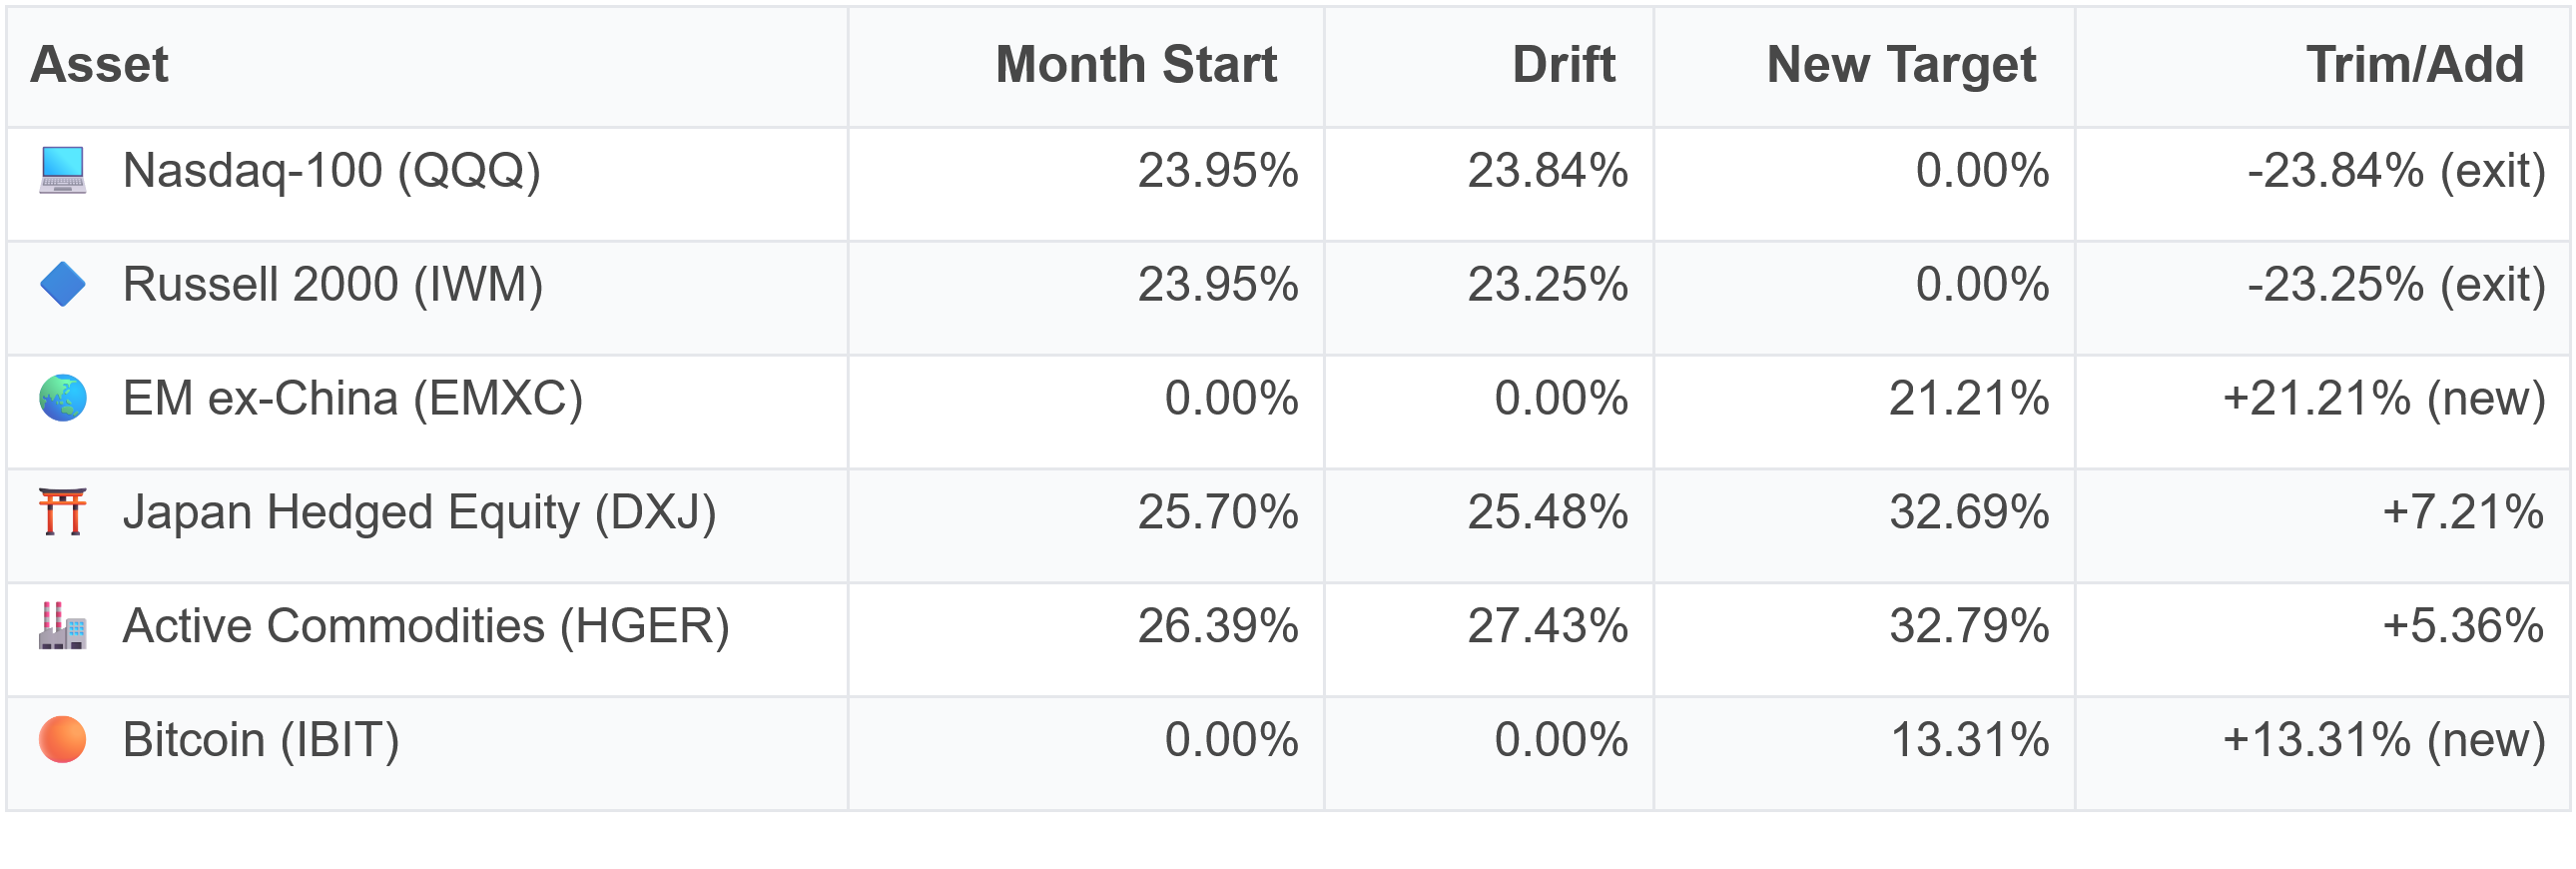
In the table above, the month start column is each position's weight at the August rebalance. The drift column is where each one landed by month-end from price movement alone. The new target is my model's recommended weight for September. The trim/add column is the trade itself, where a positive number means I am adding and a negative number means I am trimming.
- 🆕 Emerging markets ex-China returns at 21.21% after a single month away, and it is still the strongest year-to-date performer in my universe at 35.84%
- 🆕 Bitcoin (IBIT) returns at 13.31%, its first month in the portfolio since November 2025
- 📤 Nasdaq-100 and Russell 2000 both exit, leaving me with no U.S. equity position for the first time since April
- ⚖️ Japan hedged equity and active commodities both get topped up, to 32.69% and 32.79%, together about two-thirds of the portfolio
Half the portfolio turning over in a single month is rare for this strategy. The reason is probably not what you would expect.
U.S. stocks did not exit the portfolio because they declined. The Nasdaq-100 returned 4.13% in August and the Russell 2000 returned 1.56%. Both gained during a month of record highs. They dropped below the cutoff because other asset classes outperformed. Emerging markets ex-China returned 6.55%, Japan hedged equity returned 3.73% on top of a stronger year, and active commodities returned 8.77%.
Relative strength is relative. Each month my strategy ranks 10 asset classes against each other, and only the top four make the portfolio. An asset can post a positive month and still finish fifth.
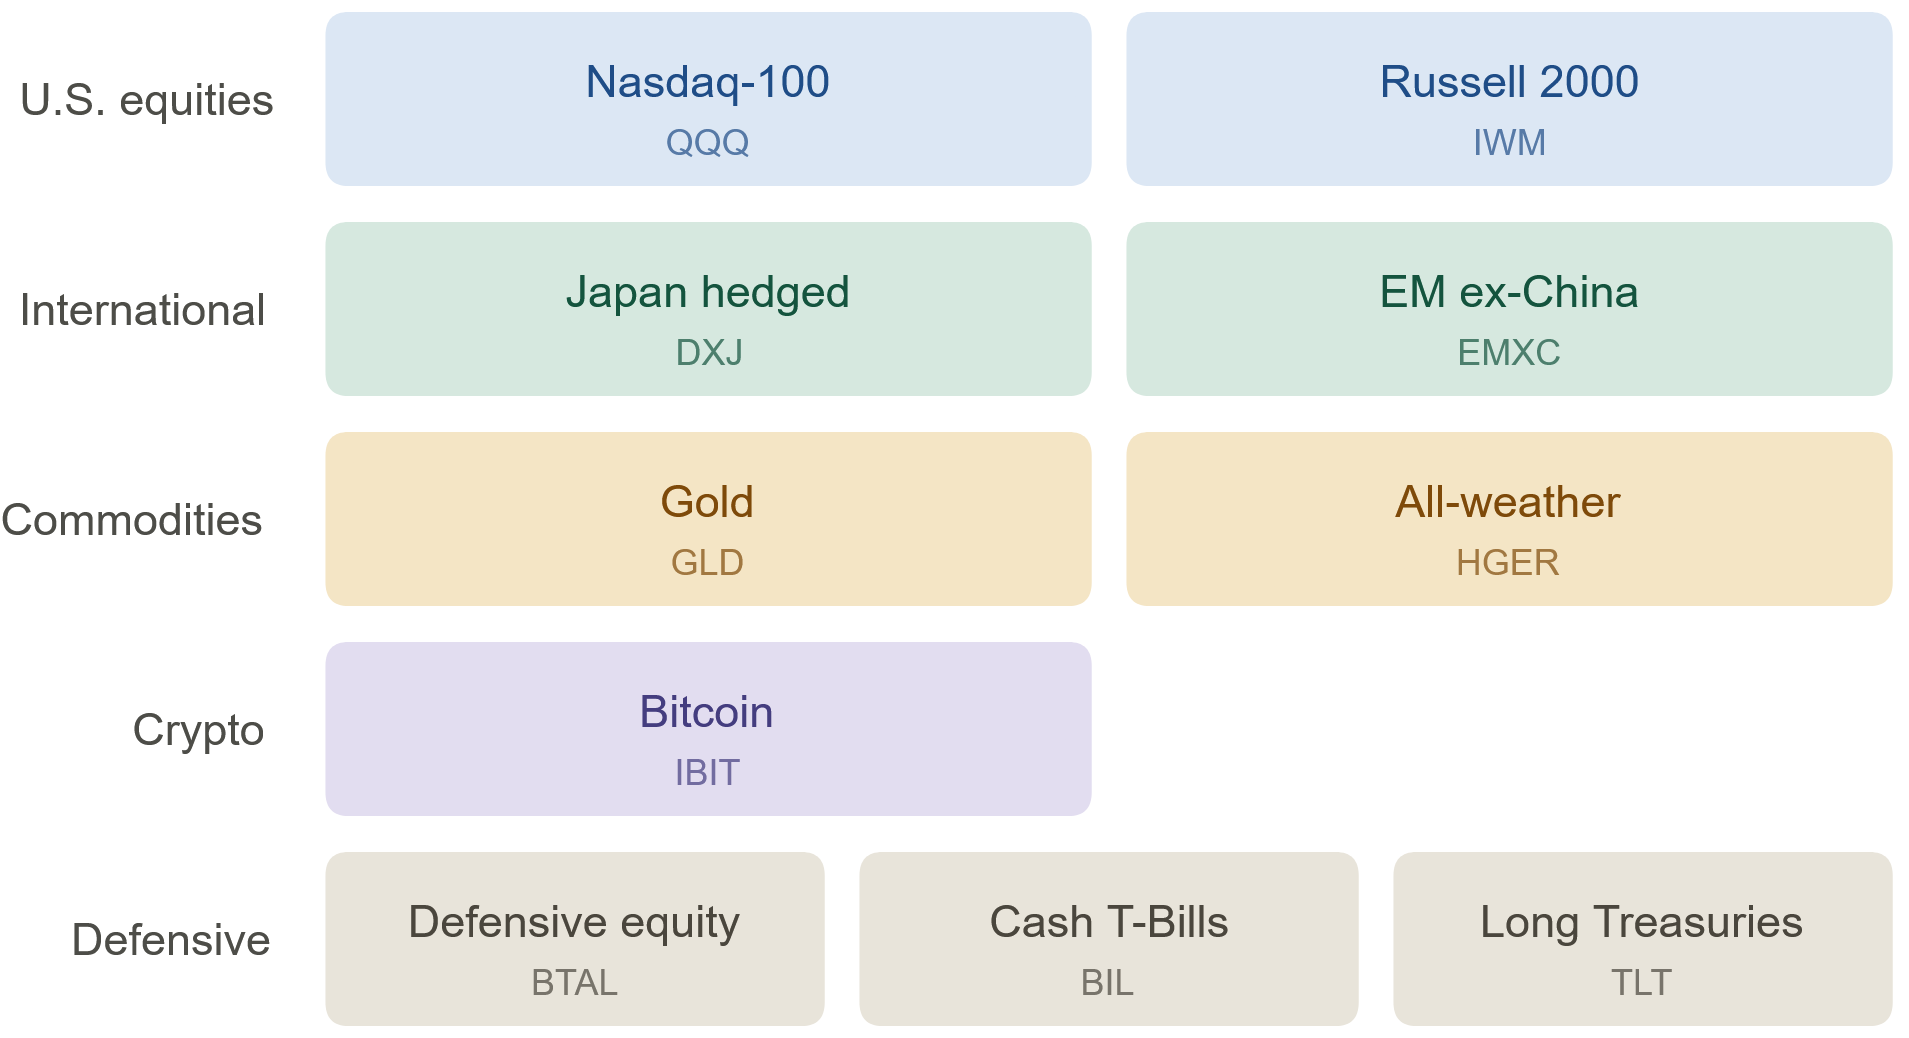
Here is everything the strategy chooses from. Four of these ten make the portfolio each month, and two of August's four are being replaced.
A weaker dollar is part of the explanation. It fell from roughly 101.40 in late July to 98.55 on August 22, its lowest since mid-May.
When the dollar weakens, assets priced in other currencies are worth more to a dollar-based investor. That helps emerging markets ex-China directly, but it does not explain the gain in my Japan position. DXJ is currency-hedged, which removes the effect of the yen, so its gain came from Japanese stock market performance rather than from currency.
Relative strength ranking determines what I hold. Sizing is a separate rule. Commodities and Japan both get larger allocations this month compared to last, from 27.43% and 25.48% to 32.79% and 32.69%, while Bitcoin enters at only 13.31%.
Risk parity determines how I size positions. The model weights each position so all four contribute a similar amount of risk. Bitcoin's price moves around much more from day to day than the other three, so it receives the smallest weight even though it is the strongest recent performer. The same rule gave it roughly 10% to 11% the last time I held it.
Quick Take
August was a good month. The strategy returned 4.64% against 2.45% for the 80/20 benchmark and 2.99% for the S&P 500. The two best performers in the basket of assets my strategy tracks were Bitcoin and gold, and I owned neither. Active commodities, which the strategy did own, came in third.
Year-to-date, $10,000 invested in the strategy on January 1 would be worth approximately $12,669 today. The same $10,000 in the S&P 500 would be worth approximately $11,342. Since the strategy went live on January 2, 2024, $10,000 would be worth approximately $17,856.
Charting the Growth of $10,000
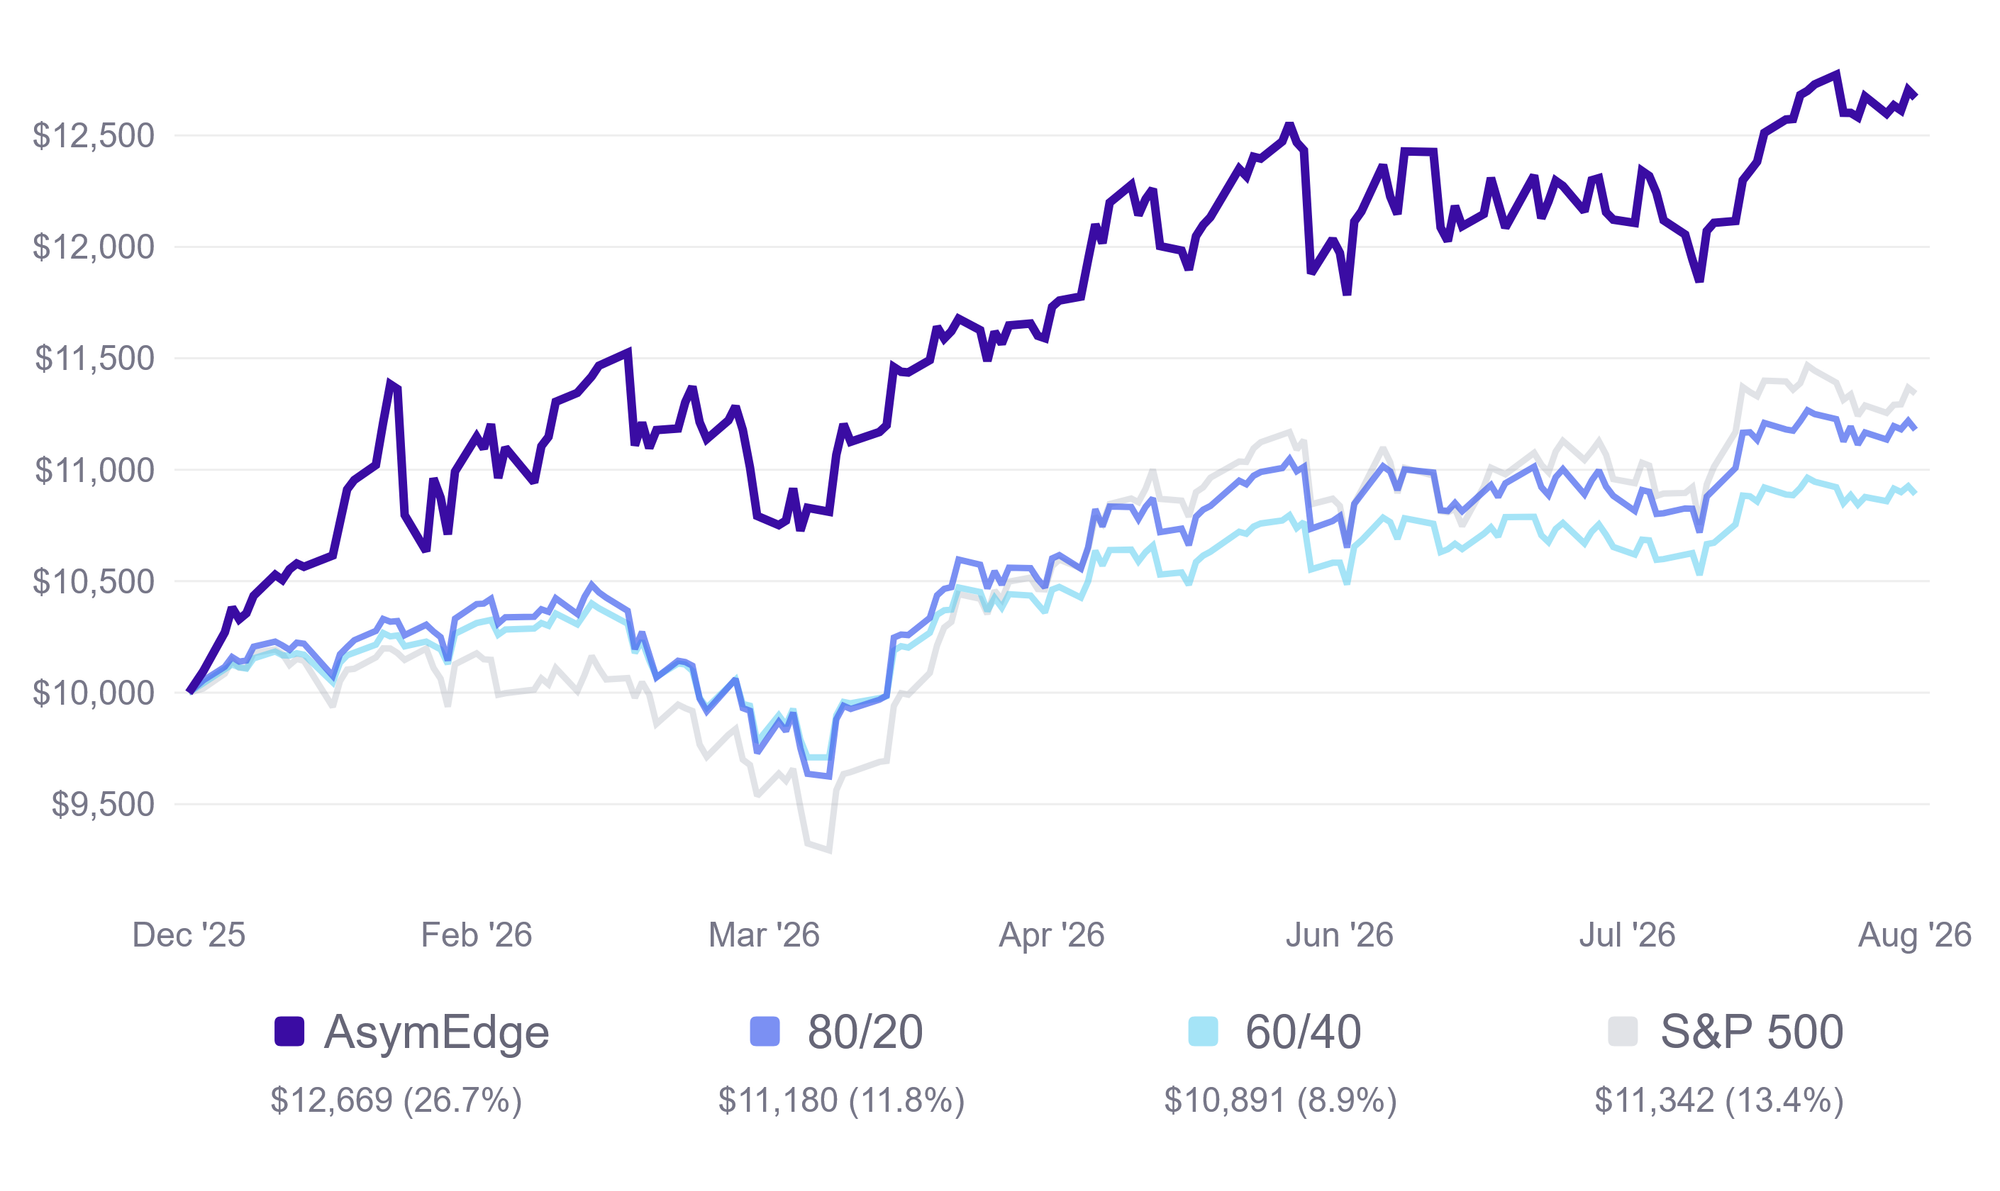
The gap widened again this month. The strategy and the benchmarks all moved higher in August, but the spread between the strategy and the benchmarks I track is now roughly 15 percentage points on the year.
Year-to-Date Asset Class Returns
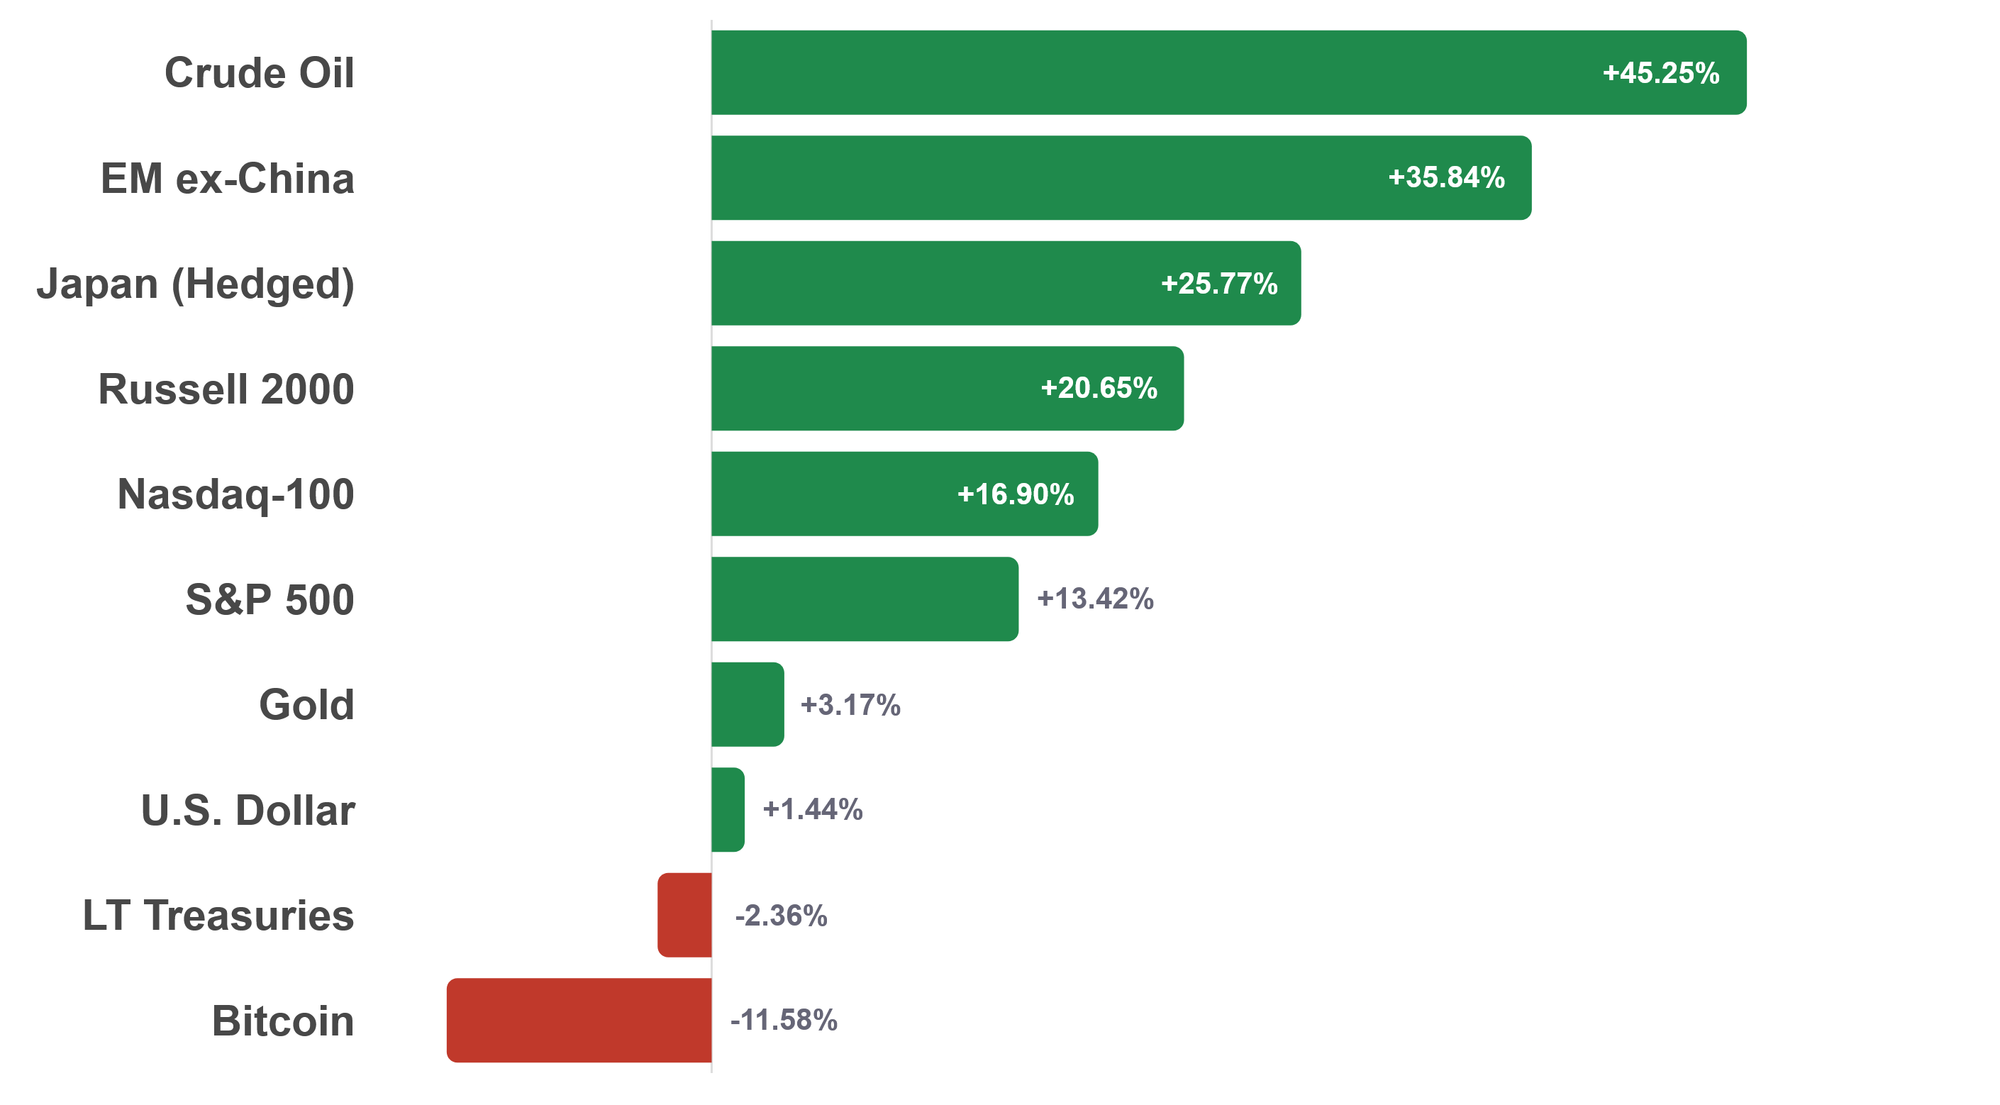
This chart explains most of the September lineup. Among the ten assets I rank, emerging markets ex-China leads at 35.84%, while Bitcoin is still down 11.58% for the year despite its August gain. The rankings are not a view about which assets deserve to win. They are a measurement of which ones have been winning.
Brief Market Commentary
Everything went up. Some things went up more. The Dow crossed 54,000 on August 4 and the S&P 500 set record closes twice in two weeks.
The Nasdaq-100 returned 4.13% and the Russell 2000 returned 1.56%. Emerging markets ex-China returned 6.55% and commodities returned 8.77%. Both U.S. positions ranked below the cutoff.
My commodity position, active commodities (HGER), is an actively managed fund rather than an index tracker, and gold is currently 33.6% of what it holds. That is why it returned 8.77% even though Brent crude finished August near $90.55 a barrel, roughly flat on the month. Gold traded near $4,268 on August 6, and central banks bought 288.9 tons last quarter.
Bitcoin recovered sharply. It returned 23.18% in August and reached a three-month high near $80,000, after gaining 22% in a single week. It remains down 11.58% for the year. That combination, a deep decline followed by a fast recovery, is what moved it back into the top four.
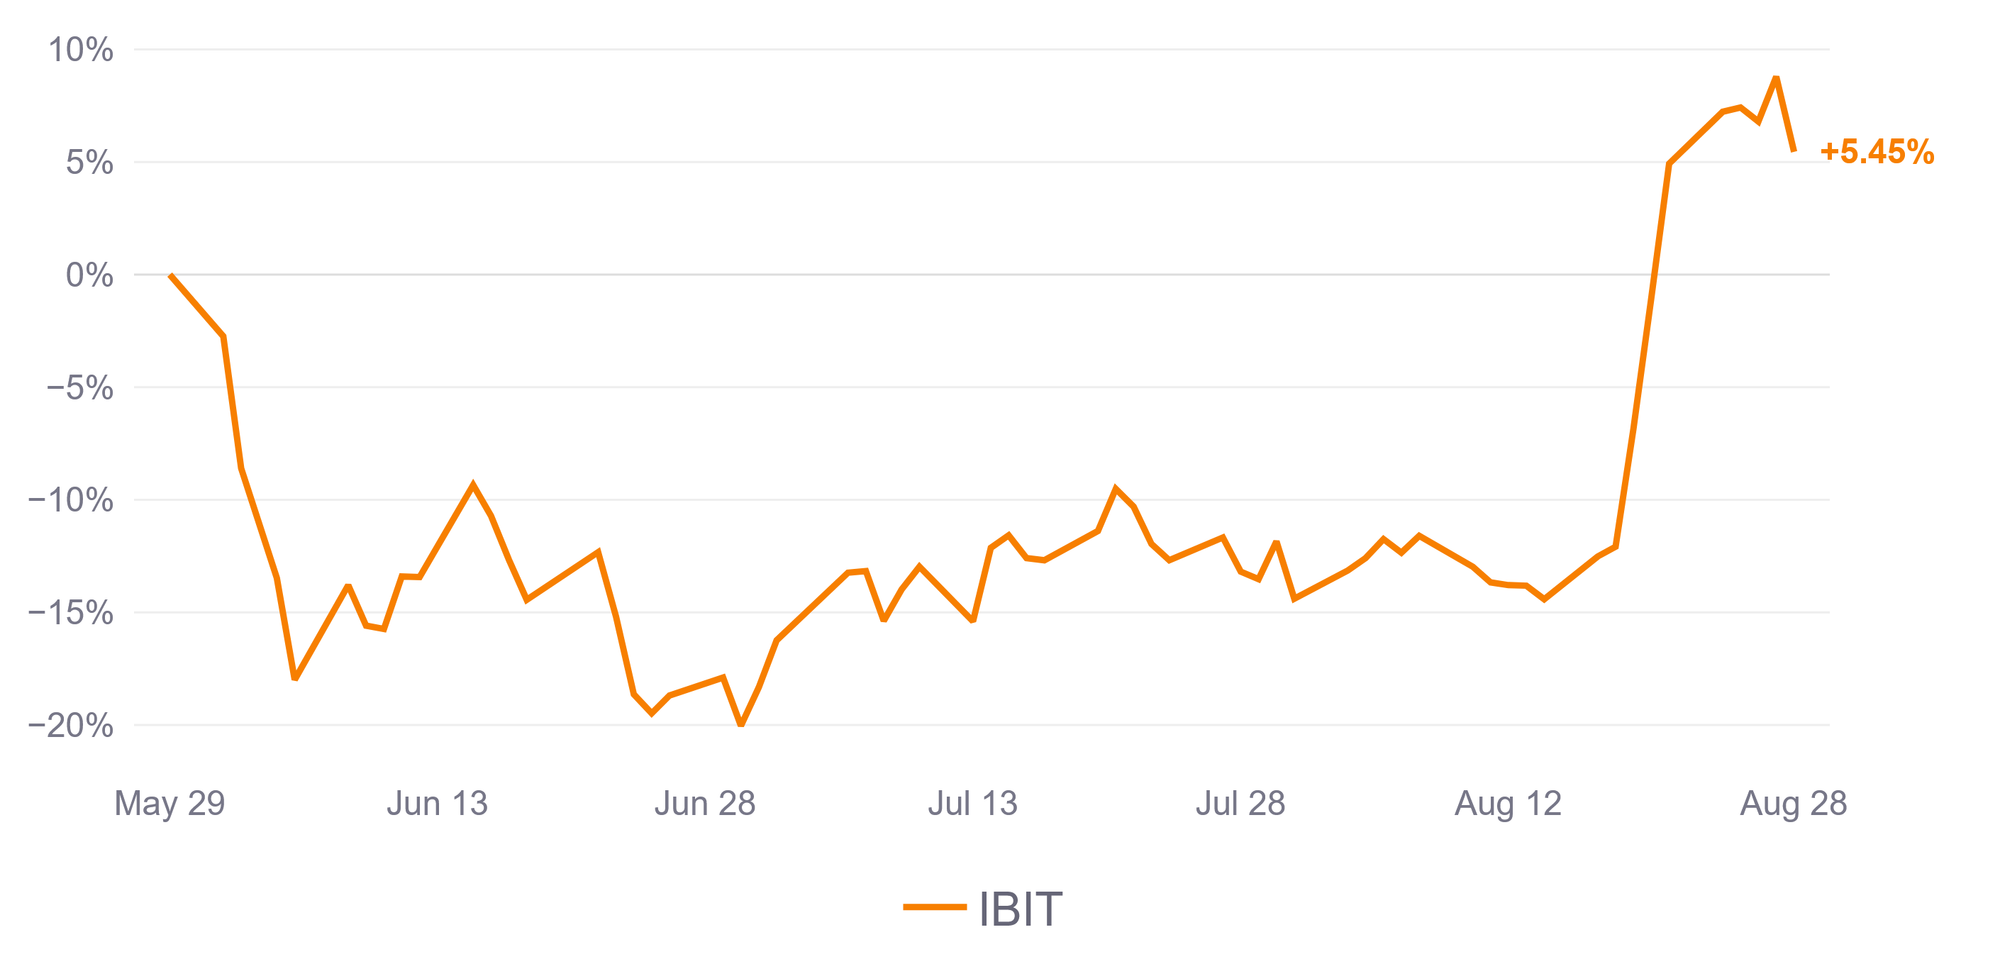
How Bitcoin got here matters. Bitcoin was down more than 20% at the end of June and spent most of the summer below where it started. Almost all of the recovery arrived in the last two weeks of August. That is what it looks like when a position qualifies on a sharp recovery rather than on a steady climb.
My first reaction to seeing Bitcoin back in the top four was disappointment. Sentiment around it has been poor for months, and cryptocurrency has rarely crossed my mind this year. Yet Bitcoin has been one of the larger contributors to the strategy's returns since it went live in January 2024 and in backtests going back much further.
I have put a great deal of work into systematizing this strategy, running thousands of backtests, and committing to those rules before I know what they will recommend. Changing them after an uncomfortable signal would defeat the purpose of having them.
That work is what lets me act on a recommendation when executing it feels uncomfortable.
I have come to treat that discomfort as something to lean into. The positions I have found hardest to buy have often been the ones that worked out for me, and Bitcoin's recoveries have tended to arrive quickly rather than gradually.
What I'm Watching
Inflation and the Fed. In his August 28 Jackson Hole remarks, Chairman Warsh pointed to PCE inflation, short for personal consumption expenditures and the gauge the Fed watches most closely, running near 3.7% over twelve months and 4.1% over six, and said plainly that the Fed has work to do. Markets have been pricing roughly a one-in-three chance of a rate increase in September rather than a cut.
If that repricing keeps pressure on the dollar, the assets I now hold could continue to benefit. If it reverses and U.S. equities move back ahead, the strategy will follow the rankings rather than my opinion about them.
Up Next
The full September newsletter is coming mid-September with detailed performance data, risk metrics, and this month's deep dive. Thanks for reading.

Disclaimer & Disclosure
This newsletter is for informational purposes only and does not constitute financial advice, investment recommendations, or an offer to sell or buy any securities. The content is published as a journal of the author's personal investment activities and is intended for a general audience.
No Investment Advice: The author is not a financial advisor. You should not treat any opinion expressed herein as a specific inducement to make a particular investment or follow a particular strategy, but only as an expression of opinion.
Risk Warning: Investment involves risk, including the possible loss of principal. Past performance is not indicative of future results. No investment strategy or risk management technique can guarantee returns or eliminate risk in any market environment.
Data & Accuracy: Information contained herein has been obtained from sources believed to be reliable, but its accuracy and completeness are not guaranteed. All expressions of opinion are subject to change without notice in reaction to shifting market conditions.
Positions: The author currently holds positions in the securities mentioned in this newsletter. The author may buy or sell these securities at any time without notice.
Copyright: This content is provided solely for the personal use of the subscriber. Any unauthorized copying, forwarding, or distribution of this material is prohibited without prior written consent.