The Month My Portfolio Almost Went to Cash
At the end of July, cash nearly broke into the top four holdings on momentum. That would have moved 94% of the portfolio to the sidelines. Instead, the strategy stayed invested and gained 5.50%. This issue is about what almost happened.


At a Glance
The Asymmetric Edge strategy is up 27.7% year-to-date, more than double the 12.3% return of an 80/20 portfolio over the same period. This month it also passed 80% since inception, which puts it ahead of the S&P 500 over the full life of the strategy for the first time by a clear margin.
This issue covers a month where almost everything I own went up, a September rate hike went from likely to long shot, and the asset most investors think of as safe quietly lost more money. The deep dive is about what “safe” actually means, and about how close my portfolio came to going almost entirely defensive three weeks ago.
📌 This newsletter documents how I invest my own money with a simple, rules-based strategy. The aim is to match a traditional balanced portfolio with shallower drawdowns, and I share what I hold and why so you can watch it play out.
What Moved
- 📈 All four portfolio positions gained. Active commodities led at 6.81% month-to-date, followed by the Nasdaq-100 at 6.09%.
- 🏦 The 30-year Treasury yield topped 5.31%, its highest since 2007, even as inflation data came in cool.
- 🏛️ Rate-hike expectations flipped. Odds of a September increase went from roughly 80% on July 29 to about 33% today.
- 🛢️ Brent crude closed at $91.10, with only five cargo vessels transiting the Strait of Hormuz on a recent Saturday against 31 the weekend before.
- 💵 The dollar sagged to two-month lows, holding below 100.00.
Theme of the Month
A bear steepener is what happens when the short and long ends of the bond market move in opposite directions. Right now the short end of the yield curve (bonds maturing soon) is pricing no rate hike. The long end (bonds maturing decades from now) is demanding more compensation for thirty-year government debt. Both moves happened this month, on the same data.
One Number That Matters
That is the year-to-date return on long-term Treasuries, second-worst in the ten asset classes I track and behind only Bitcoin, in a year when the S&P 500 returned 13.91%. It is the number this issue turns on, and you can see it on my own asset class chart further down.
Market Moves
Portfolio and Benchmark Returns
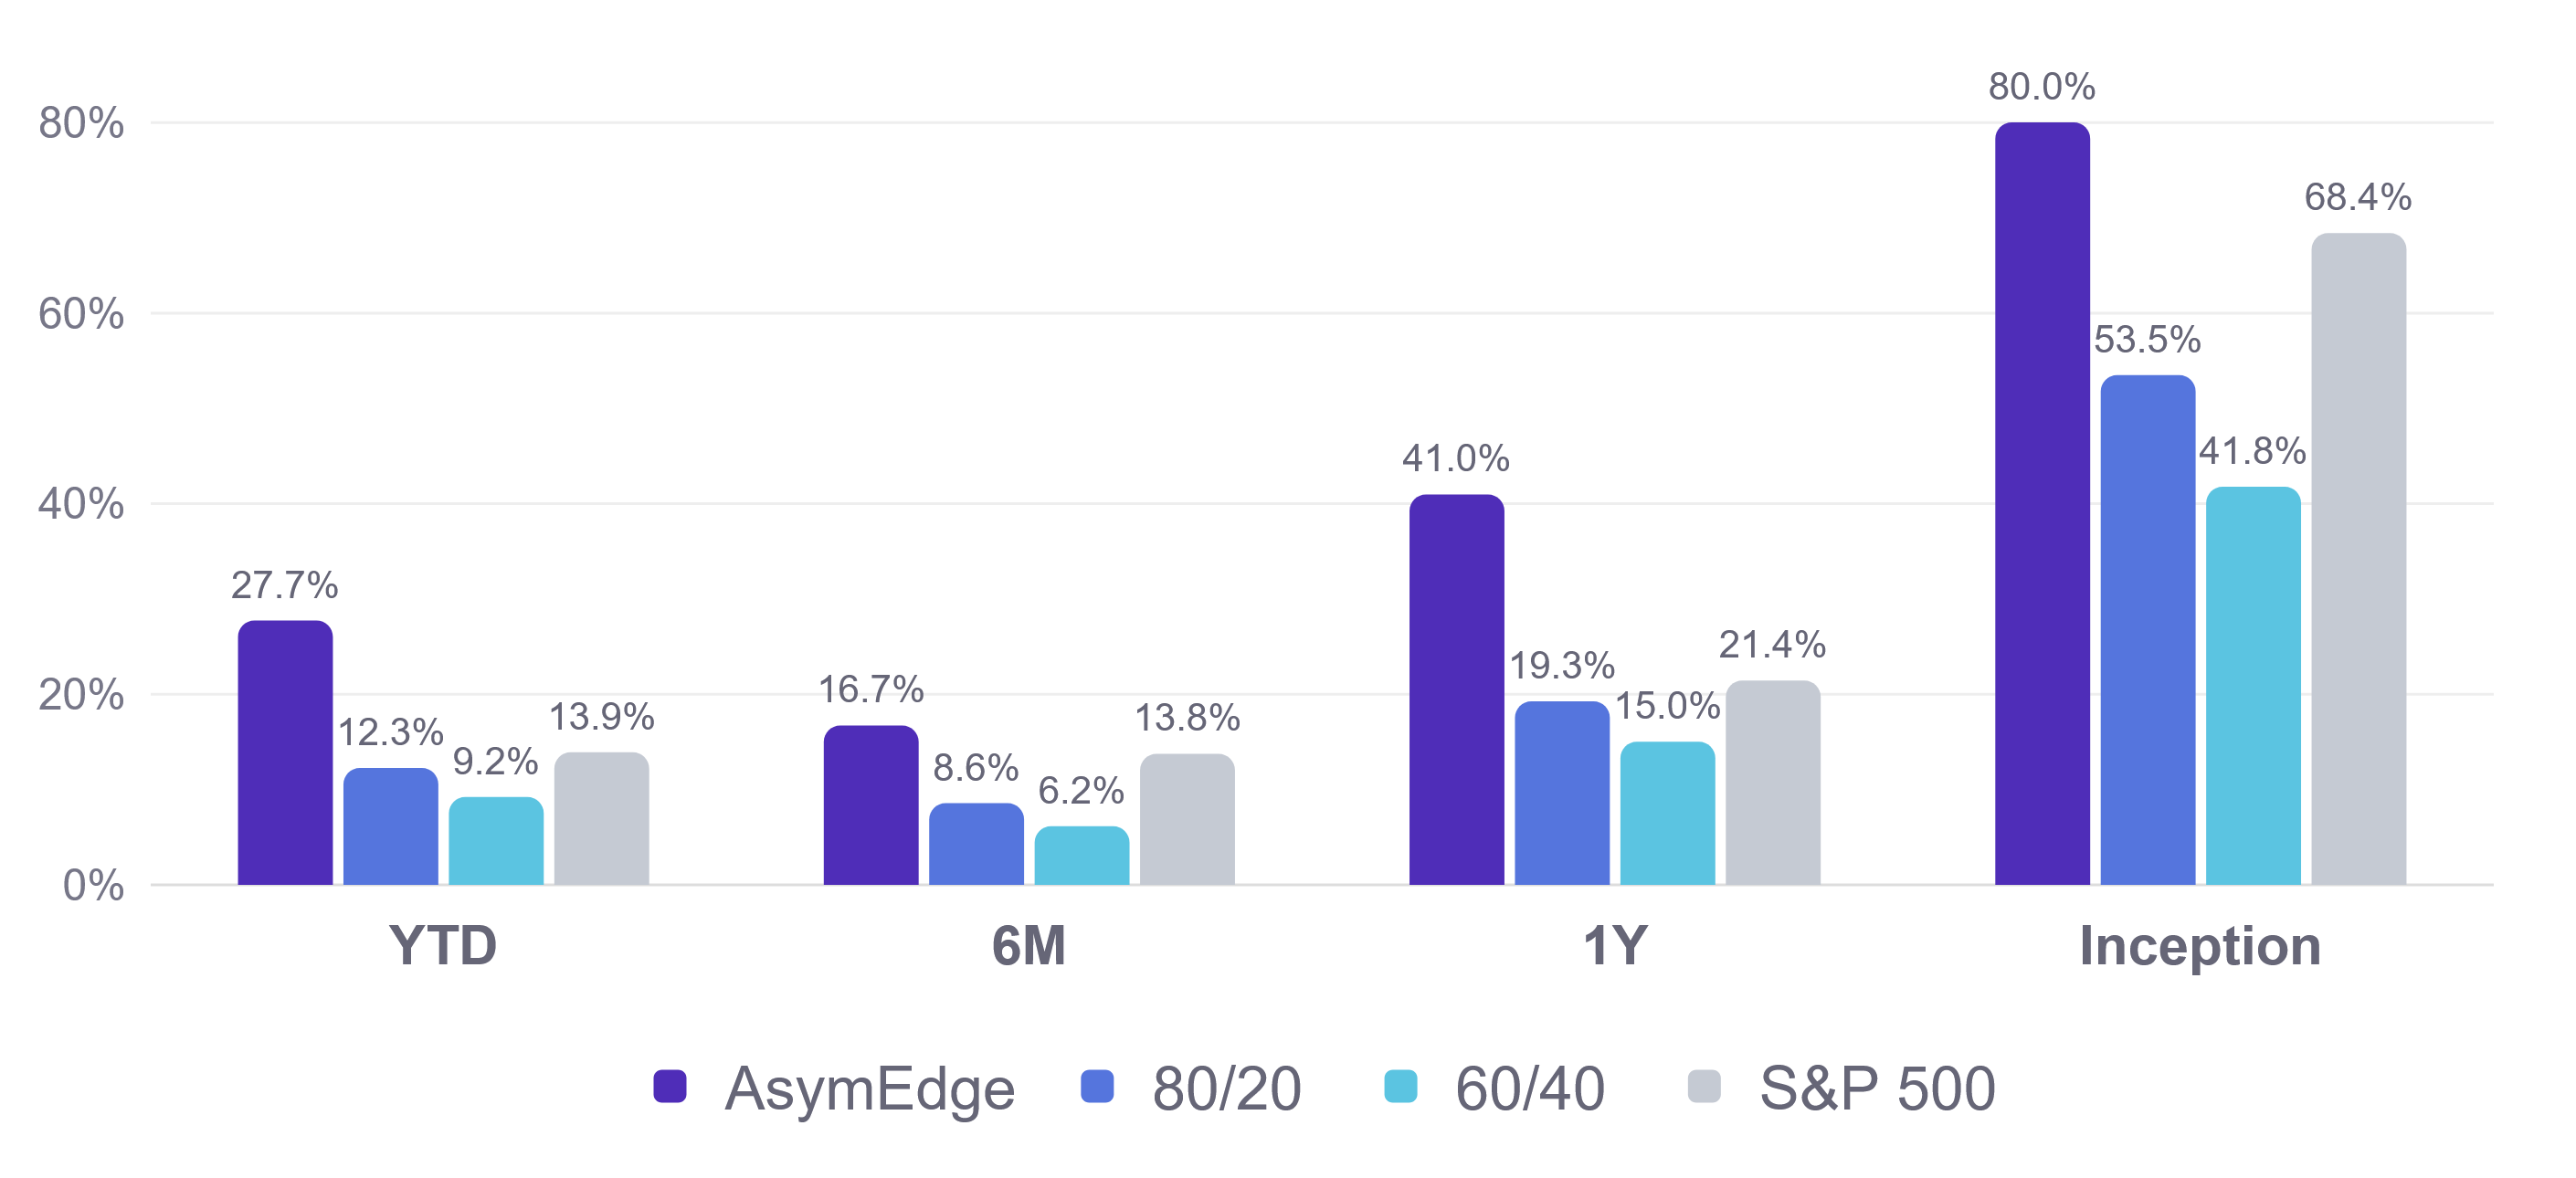
August is up 5.50% through today, the second-best month of the year behind January. The lead over the 80/20 has widened at every time horizon, including on six-month trailing returns, once again leading the S&P 500 after trailing it for most of the spring.
When everything rises together, the ranking does not get credit for picking winners. It was in the right place, and the market lifted all of it.
Charting the Growth of $10,000
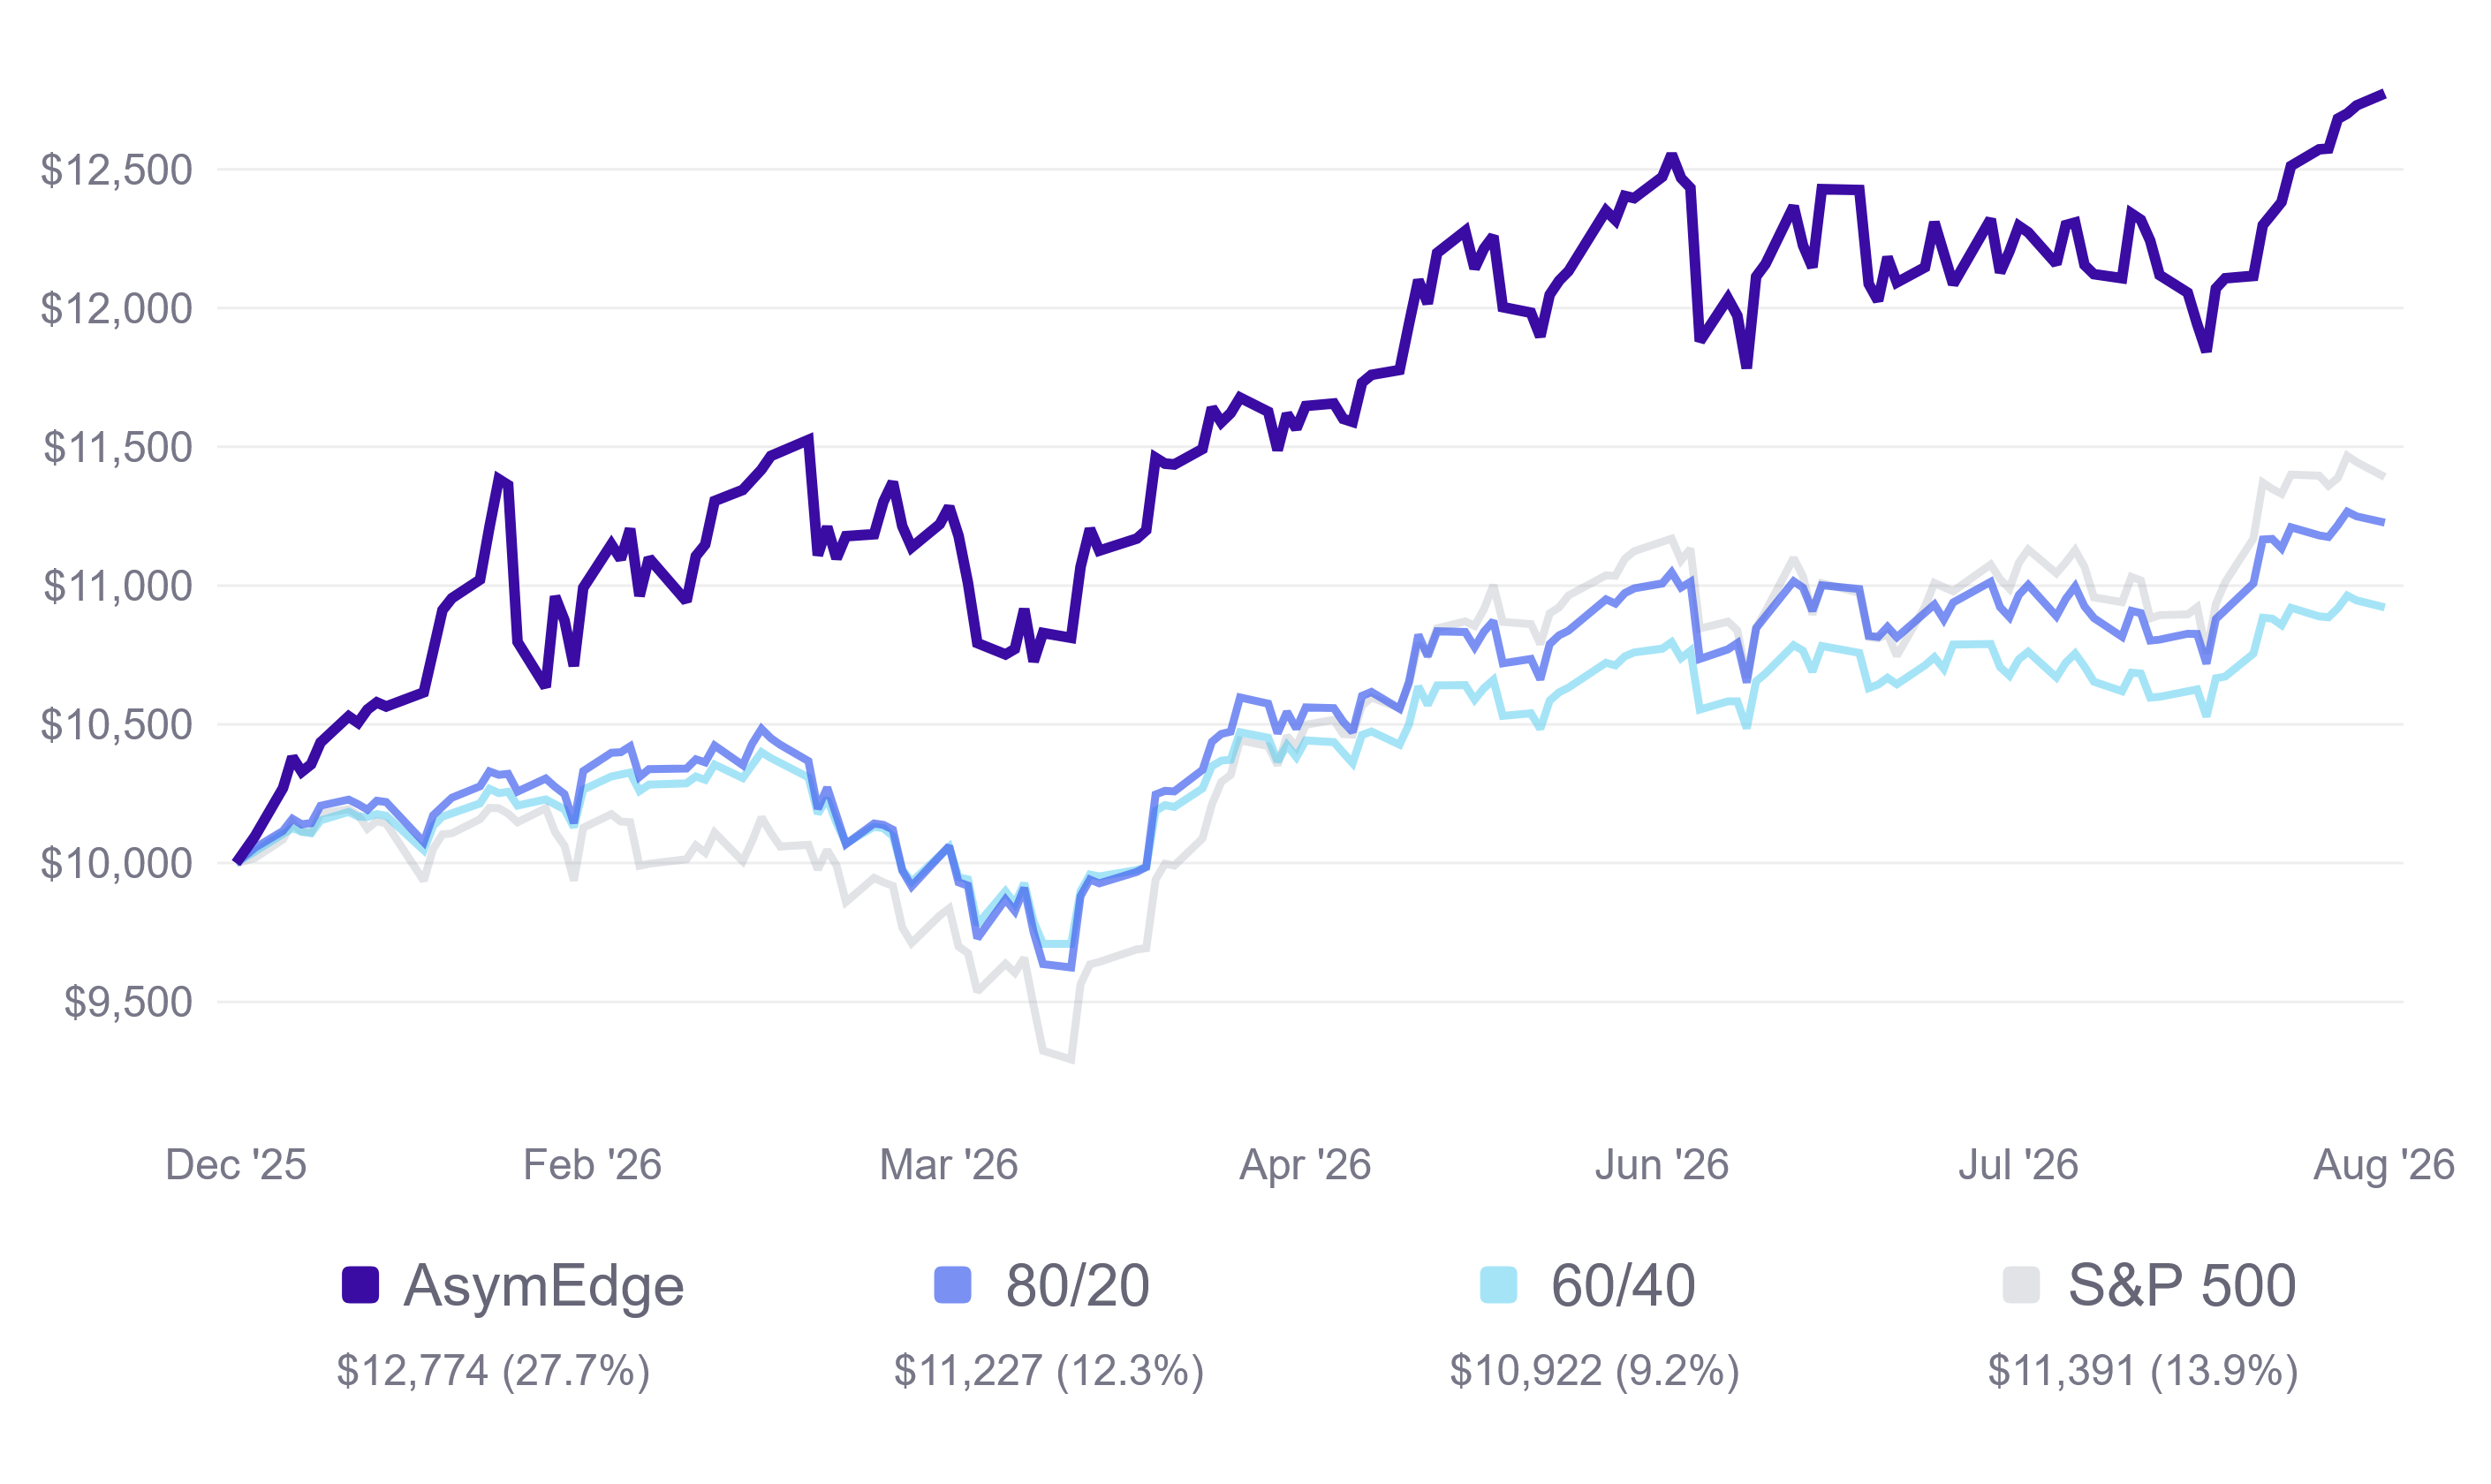
Ten thousand dollars invested at the start of this year would be worth about $12,774 in the strategy, against $11,391 in the S&P 500 and $11,227 in an 80/20 portfolio. Held since inception in January 2024, the same $10,000 would be roughly $18,003 versus $16,841 in the S&P 500.
The year-to-date line tells the story of 2026 clearly. The strategy built its lead through the first quarter, gave a piece of it back in the March selloff, drifted sideways from May through July, and then moved sharply higher over the last two weeks.
Year-to-Date Asset Class Returns
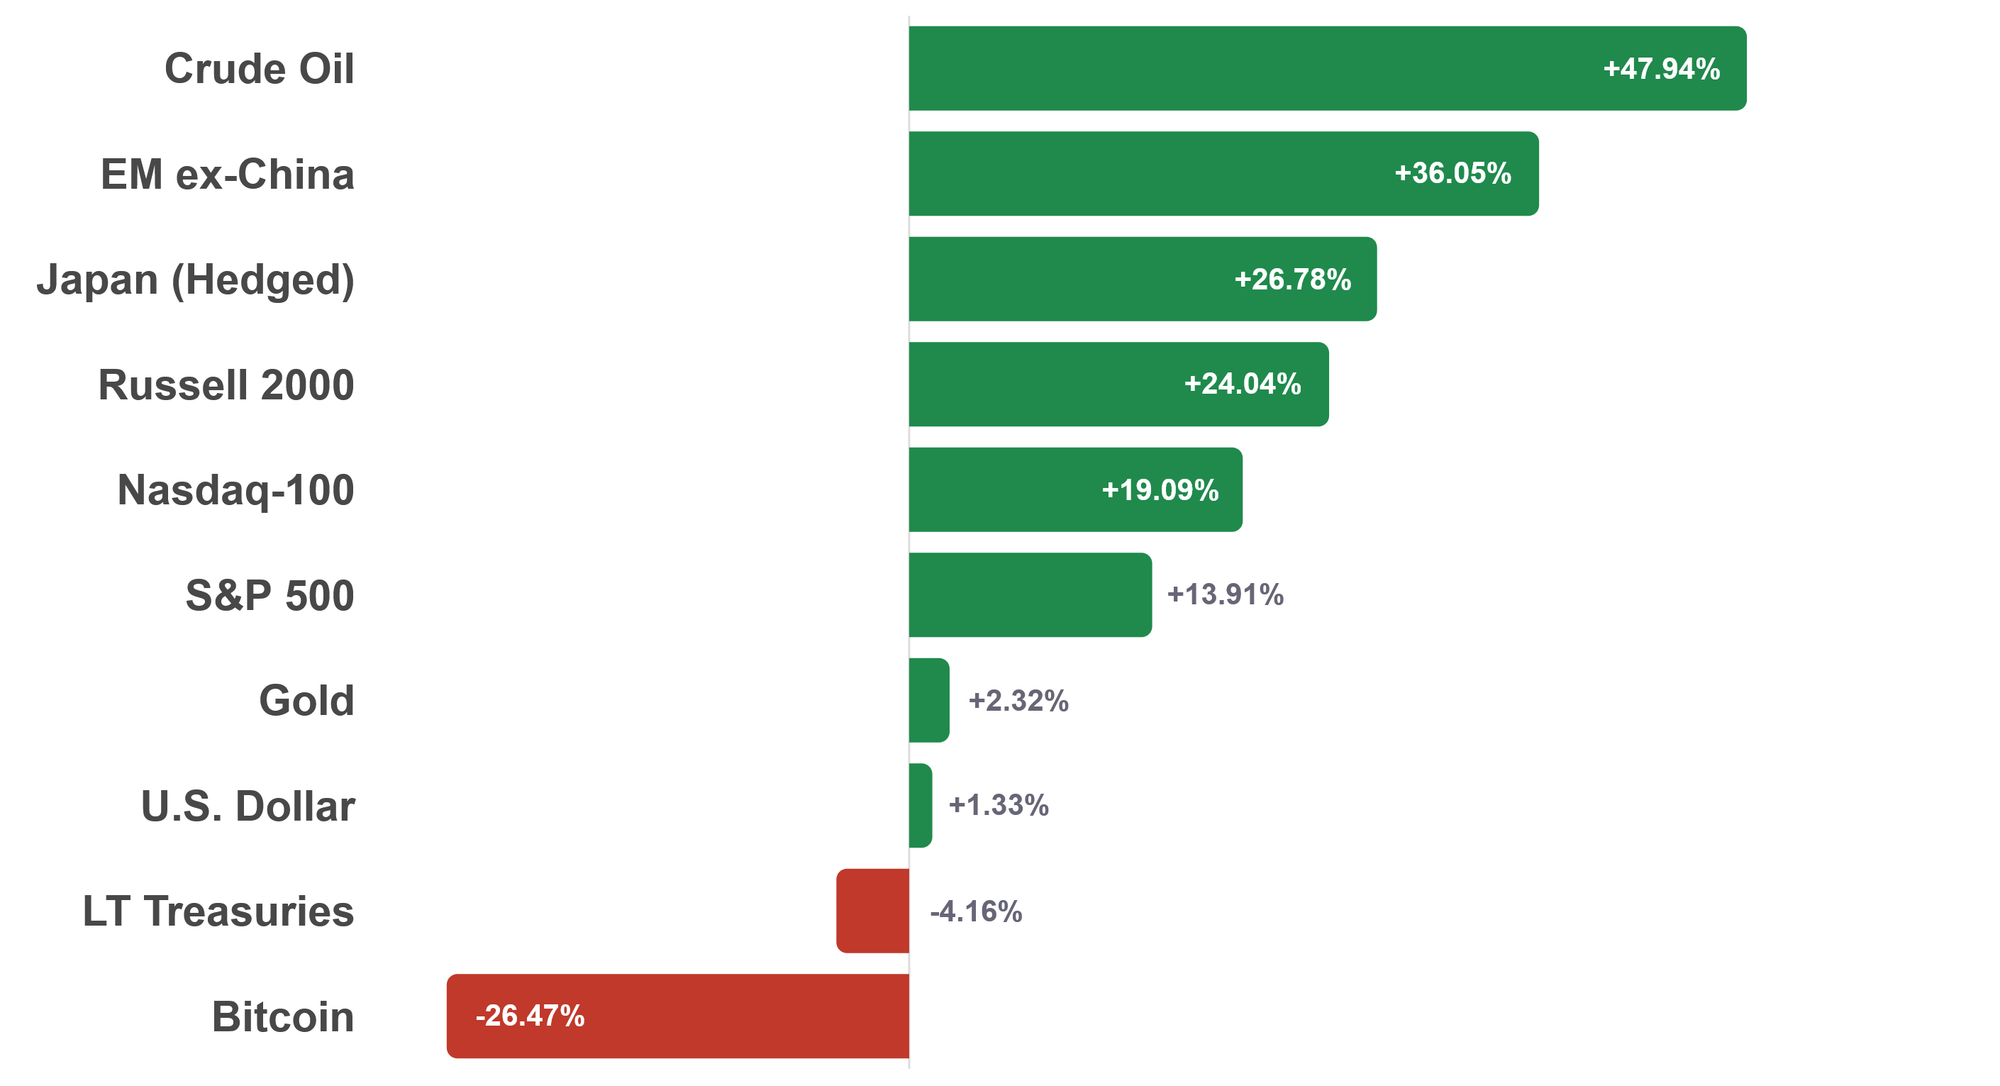
The bottom of that table is where this issue lives. Long-term Treasuries, the asset most investors reach for when they want safety, are down 4.16% on the year. Gold, the other traditional haven, is up 2.32% and has been the weakest ranked asset in my universe for most of 2026.
The Macro Picture
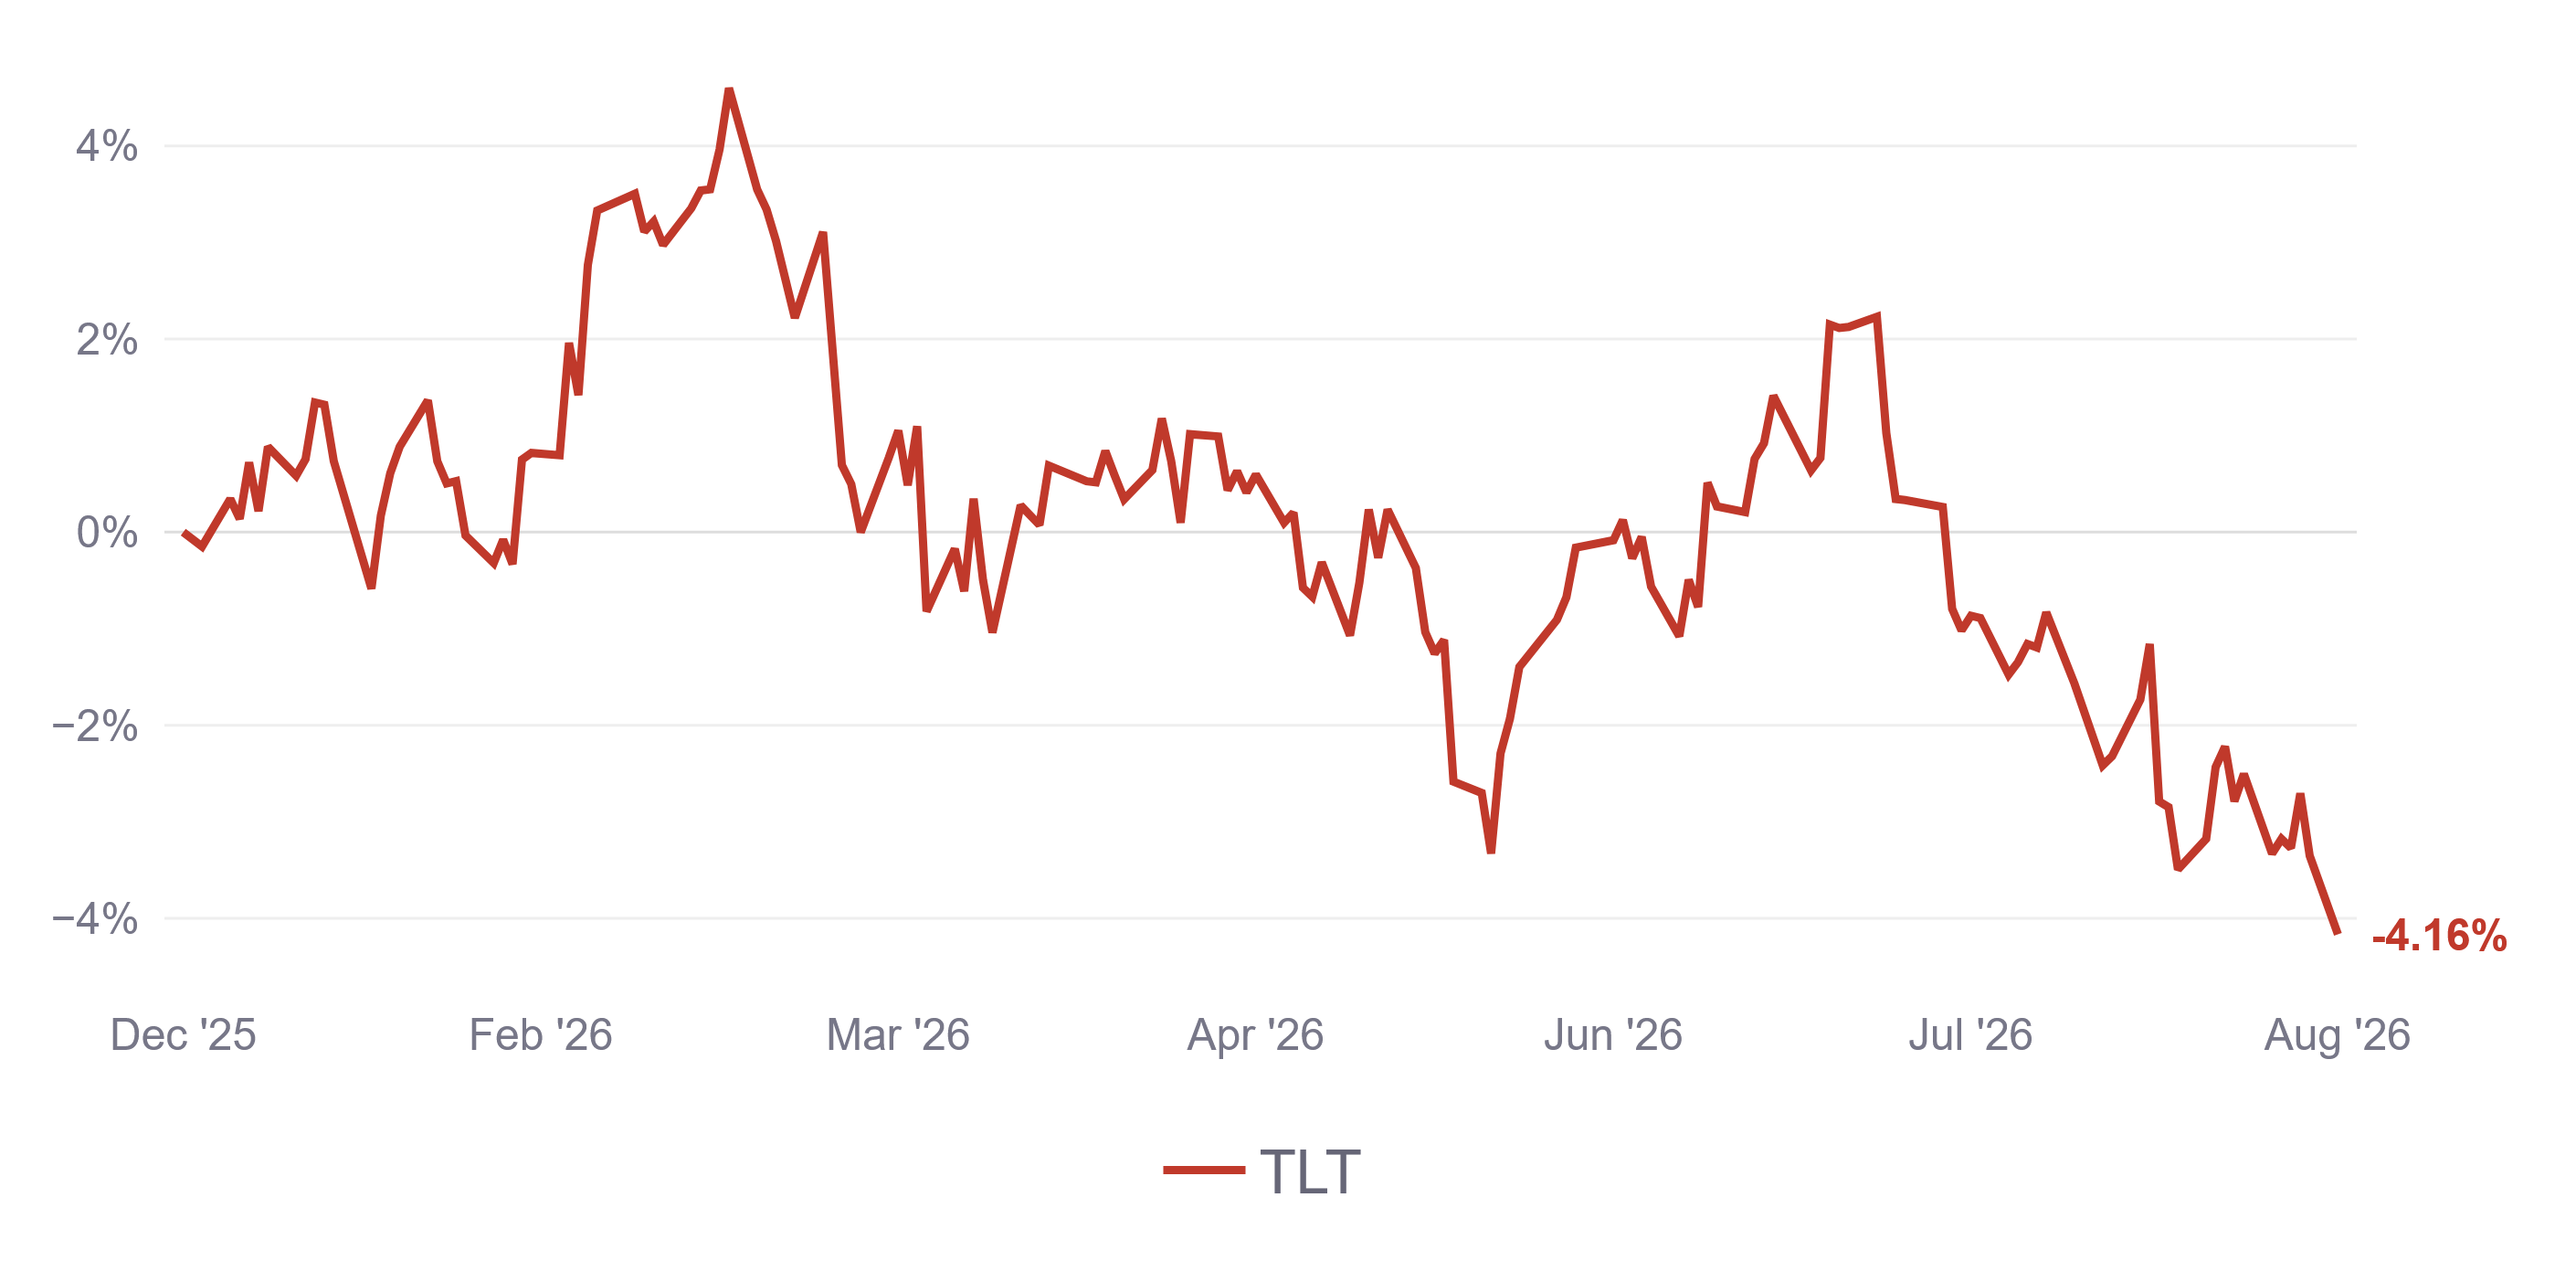
The 30-year Treasury yield topped 5.31% this week, its highest level since 2007. Inflation cooled, with July CPI at just 0.1% on the month and shelter doing nearly two-thirds of the work, cutting September hike odds from roughly 80% three weeks ago to about 33% today.
The long end went the other way. The CBO raised its deficit projection to $2.1 trillion, tech issuers are crowding the bond market to fund data centers, and investors want more compensation to hold thirty-year paper. The dollar fell to two-month lows in the same stretch, an unusual pairing with rising yields.
Energy prices feed directly into my largest position. Prices are up 14.7% year-over-year with Brent at $91.10, and Hormuz traffic collapsed to five cargo vessels on a recent Saturday against 31 the weekend before.
The consumer softened. Retail sales fell 0.6% in July, the first decline in nine months, and Michigan sentiment hit 51.0. Earnings say otherwise, with more than 85% beating estimates. Nvidia reports August 26, a direct read on the Nasdaq-100.
Portfolio Allocations
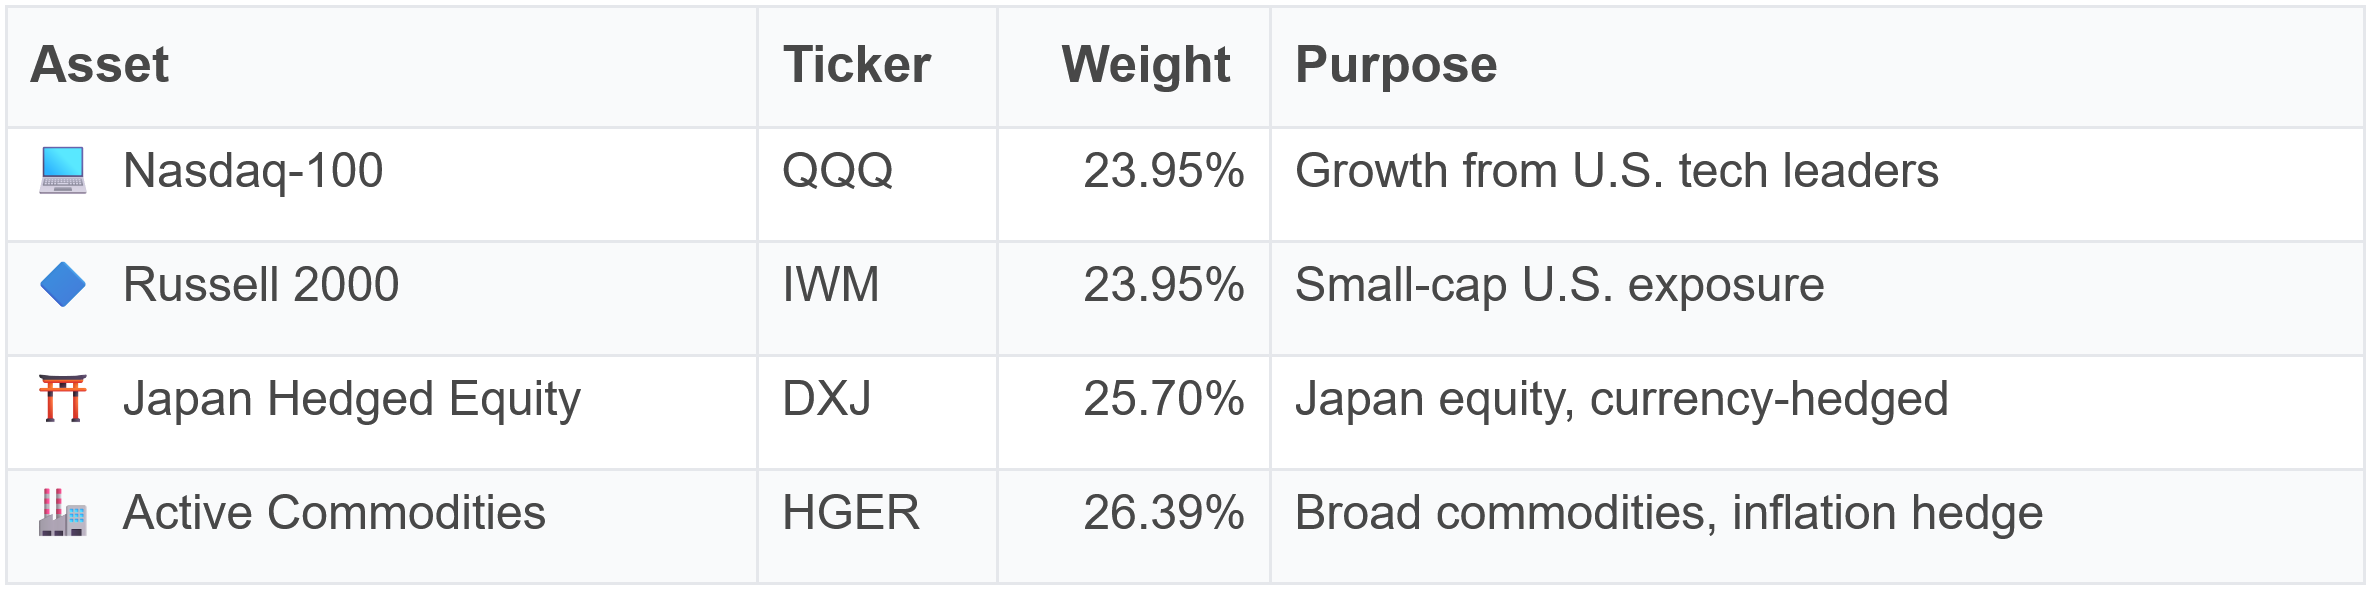
Nothing rotated this month. All four positions are up, led by active commodities at 6.81%. Japan hedged equity, which replaced emerging markets three weeks ago, is up 4.56% since it arrived.
If I were choosing positions from headlines, this allocation would look reckless. The consumer is weakening, the long bond is signaling something uncomfortable about fiscal policy, and I own no bonds and no cash. But my systematic, rules-based strategy does not read headlines. It reads relative price trends, and those four assets are what came out on top.
Deep Dive: Risk-Off Is Not One Thing
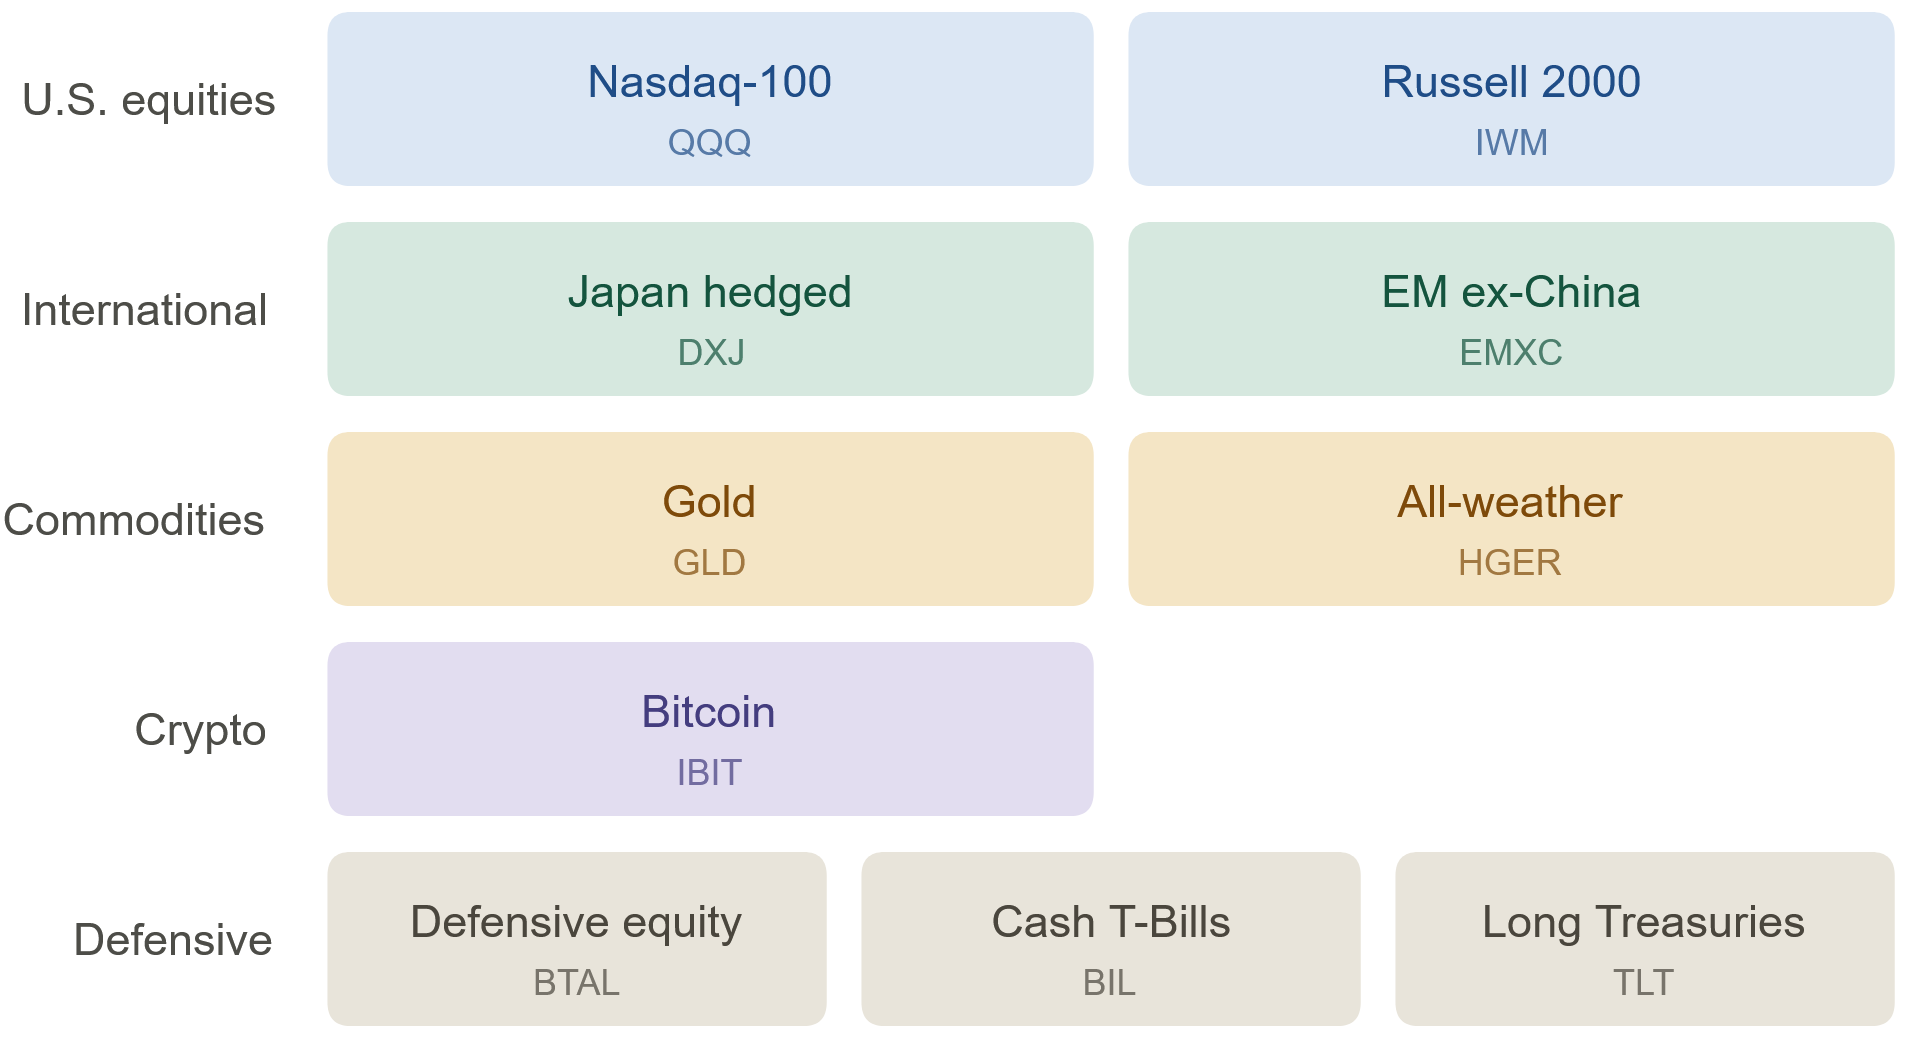
There is a word investors use for cash, Treasuries, and defensive equity, and that word is “safe.” It papers over real differences. This year, one of those assets lost more than 4% while another earned a quiet yield and did nothing else.
Three different kinds of defense
My universe has three defensive positions, and they do genuinely different jobs.
Short-term Treasuries (ticker BIL) are essentially cash: government bills maturing in one to three months, almost no sensitivity to interest rates.
Long-term Treasuries (ticker TLT) hold government bonds maturing in twenty years or more. They are only defensive when rates fall. When rates rise, a long bond can fall as hard as a stock.
Defensive equity (ticker BTAL) buys low-volatility stocks and shorts high-volatility ones, so it tends to rise when speculative names are being sold.
Three assets, one label, three completely different responses to the same conditions.
What it looks like when the strategy actually goes defensive
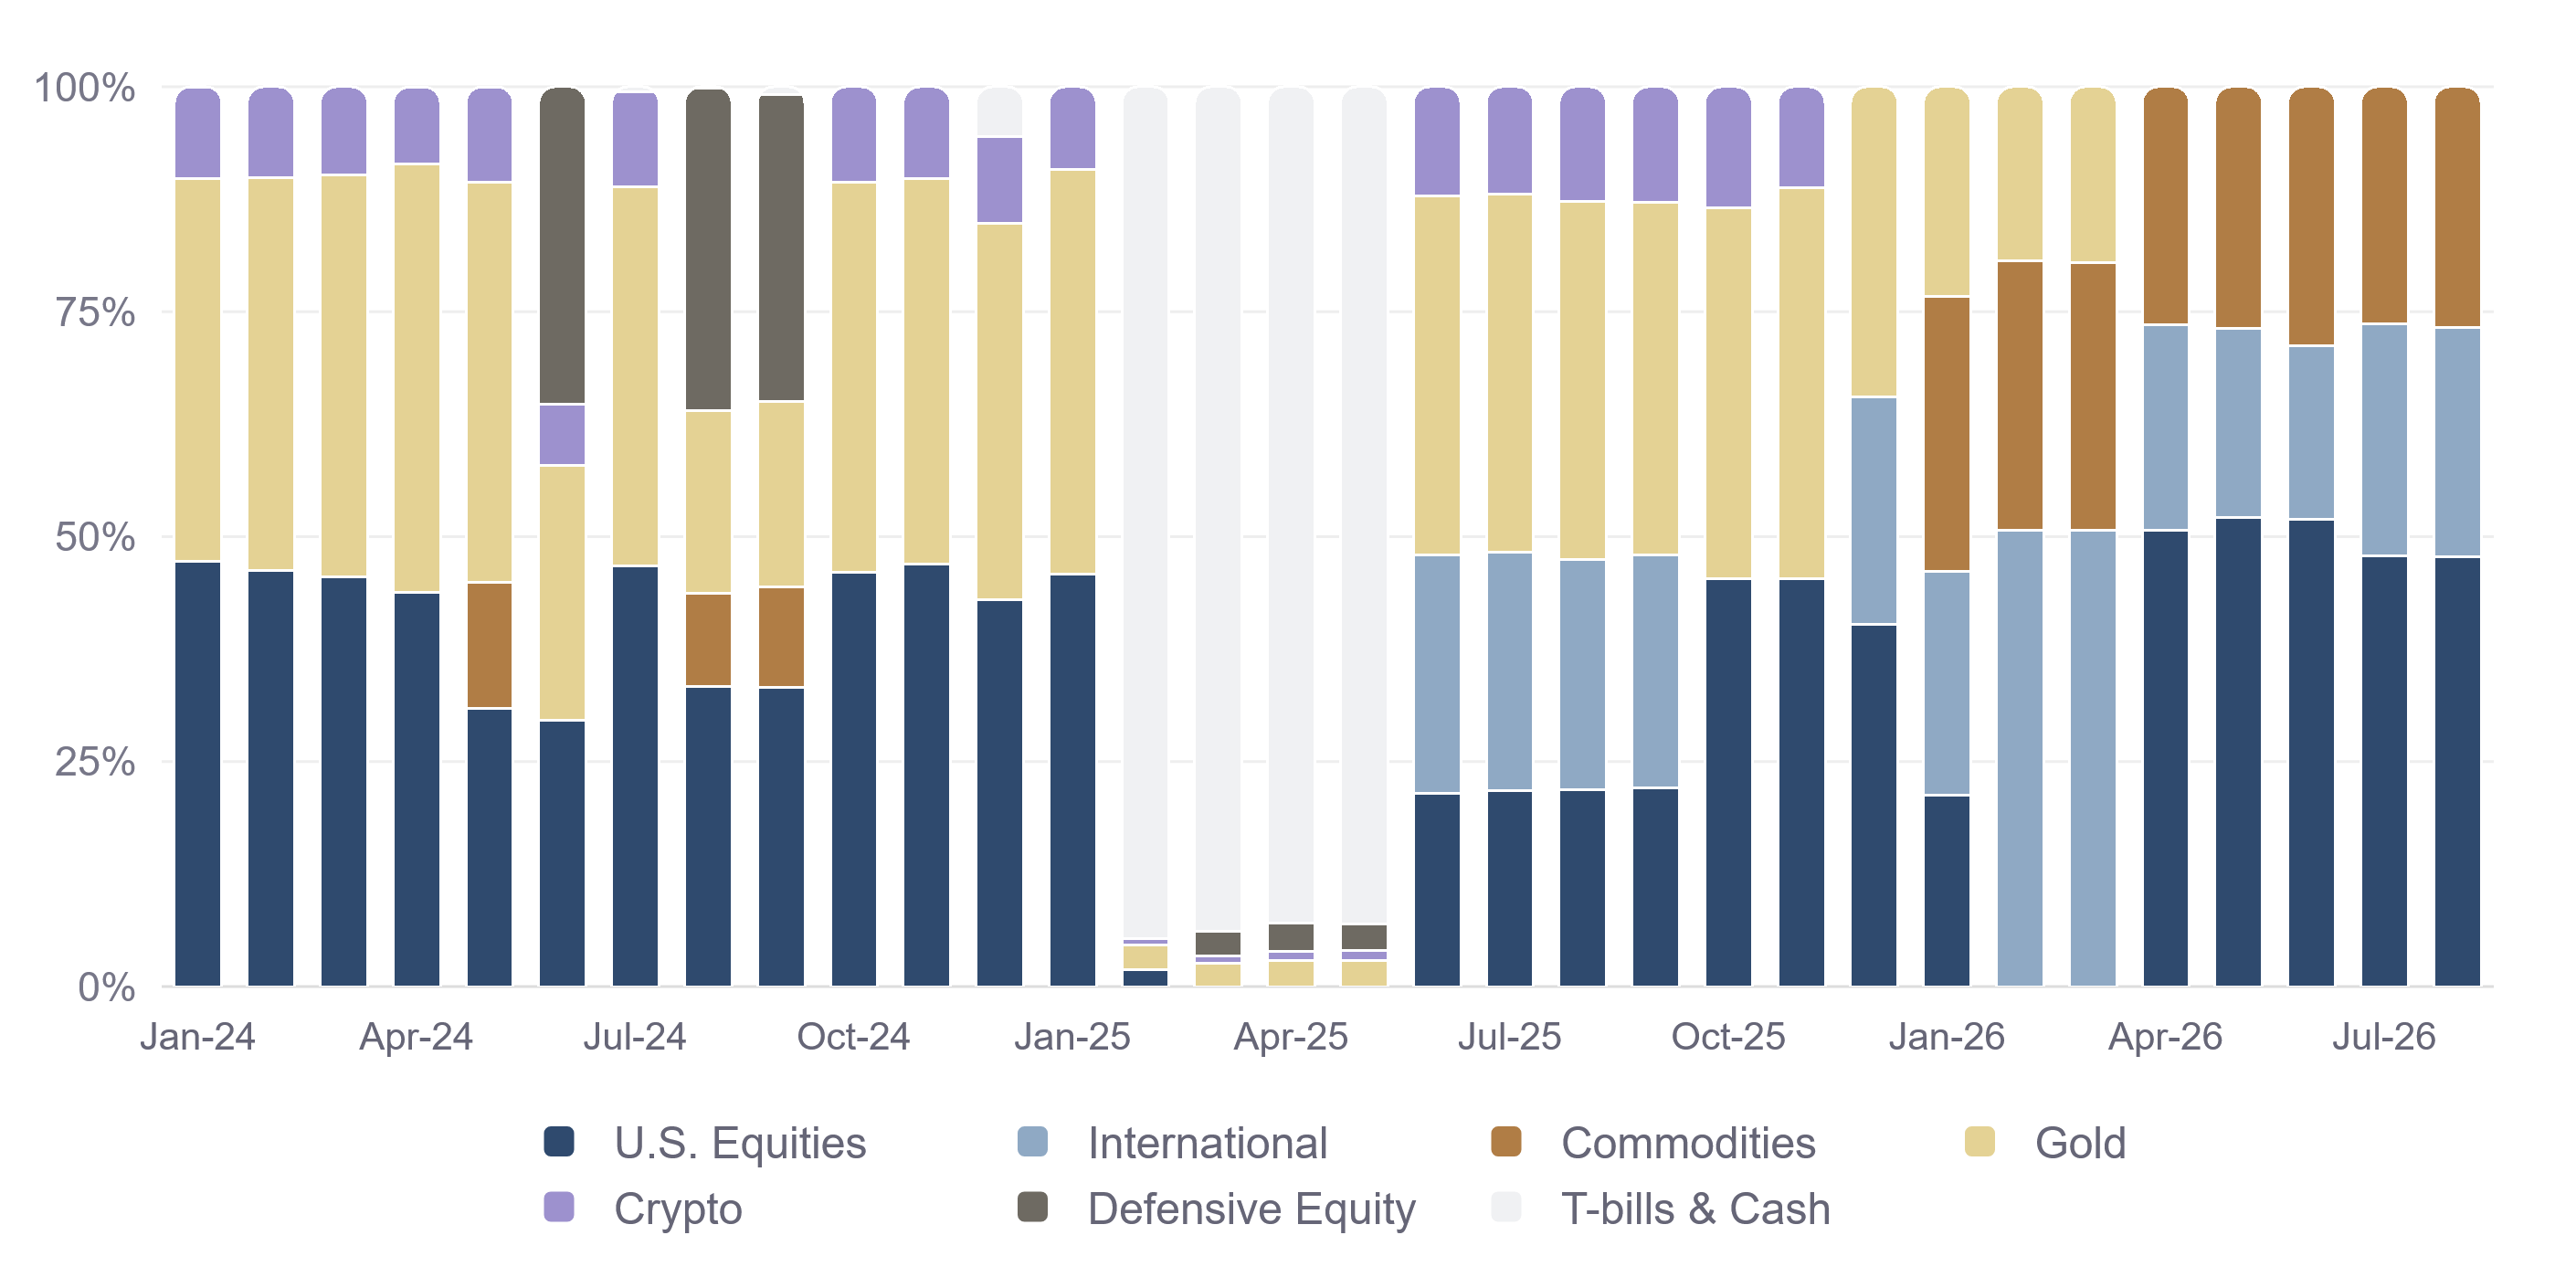
That chart shows every allocation since inception. Look at early 2025. For roughly four months, the portfolio was almost entirely short-term Treasuries. The portfolio was not partly hedged or tilted toward safety. It was nearly all cash.
I did not make that call. Every risk asset in the universe fell far enough in the relative-strength ranking that cash came out on top, and the model allocated accordingly. That is why I keep three defensive assets in a universe of ten, even in years when I never hold any of them.
It nearly happened again three weeks ago
At the end of July, short-term Treasuries finished half a percentage point outside the top four in blended momentum (the weighted average of each asset’s recent and intermediate price trends).
Had cash edged in, risk parity would have done the rest. My model sizes positions so that each holding contributes a similar amount of risk. Cash has almost no volatility, so roughly 94% of the portfolio would have moved into Treasury bills, leaving the other three positions with about two points each.
Instead the portfolio stayed fully invested and gained 5.50%. Had cash won that half-point contest, I would have spent August earning a T-bill yield while every asset I own rose between 4% and 7%.
I did not override the ranking or second-guess it. The system has earned that trust over extensive backtesting, and this month the outcome supported that approach..
And the “safe” asset lost money anyway
Over the same period, long-term Treasuries returned −4.16% year-to-date and got worse this week as the 30-year yield hit a 19-year high. An investor who moved to safety this year had two very different experiences. Short-term Treasuries earned a modest yield and held their value. Long-term Treasuries lost more than 4% while the S&P 500 gained nearly 14%.
Calling long-term Treasuries “safe” only makes sense when rates are falling. This year rates went up, and the long bond fell with them.
The cost of keeping defense on the bench
Keeping three defensive assets in a ten-asset universe means they sometimes take a spot that a higher-returning risk asset could have held. Here is what that trade-off has looked like since inception in January 2024: the largest peak-to-trough decline (measured on daily closes) has been 9.23% against 18.76% for the S&P 500, at a compound growth rate of 25.13% against 21.98%.
I do not know when the next downturn will arrive. I do not need to. The ranking will rotate me into defense on its own, and because it chooses based on which defensive asset is actually working at the time, so far that has usually meant ending up in the right one.
Wrap Up
Watching your portfolio rise 5.50% while headlines warn about a weakening consumer and a bond market at 19-year yield highs is a strange feeling, and it is exactly why I follow a system that makes the call for me. I did not decide to stay invested through this month. The ranking did, and it will decide again at the end of August.
If relative strength keeps favoring these four, nothing changes. If it does not, the portfolio could go mostly defensive, and it would happen without me weighing in. Thanks for reading.

Disclaimer & Disclosure
This newsletter is for informational purposes only and does not constitute financial advice, investment recommendations, or an offer to sell or buy any securities. The content is published as a journal of the author’s personal investment activities and is intended for a general audience.
No Investment Advice: The author is not a financial advisor. You should not treat any opinion expressed herein as a specific inducement to make a particular investment or follow a particular strategy, but only as an expression of opinion.
Risk Warning: Investment involves risk, including the possible loss of principal. Past performance is not indicative of future results. No investment strategy or risk management technique can guarantee returns or eliminate risk in any market environment.
Data & Accuracy: Information contained herein has been obtained from sources believed to be reliable, but its accuracy and completeness are not guaranteed. All expressions of opinion are subject to change without notice in reaction to shifting market conditions.
Positions: The author currently holds positions in the securities mentioned in this newsletter. The author may buy or sell these securities at any time without notice.
Copyright: This content is provided solely for the personal use of the subscriber. Any unauthorized copying, forwarding, or distribution of this material is prohibited without prior written consent.